Hi,
I'm building a chart that shows how long people take to perform certain tasks.
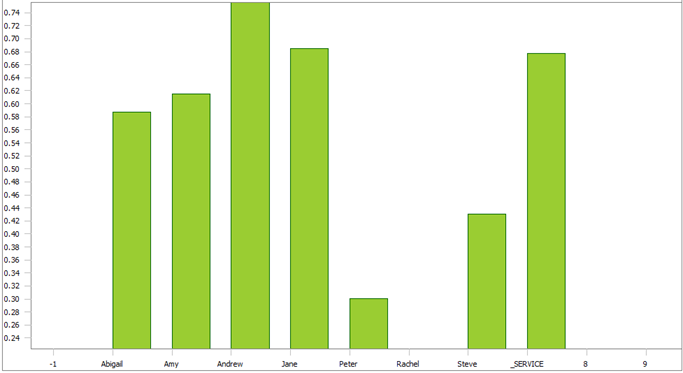
Names appear along the X axis. That's been done.
The part I'm having difficulty with is show time along the Y axis. The time can be in days, hours, minutes and seconds.
Any advice on how to implement this?
Also, how do I limit the number of points on the X axis? Say I have 9 names and therefore 9 points. The X axis labels keep going, showing sequential numbers, eg. 9,10,11, etc. And if I go back the other way it shows -1, -2, -3 etc.
Thanks,
Steve