Hello I'm try tu use a Access DB with
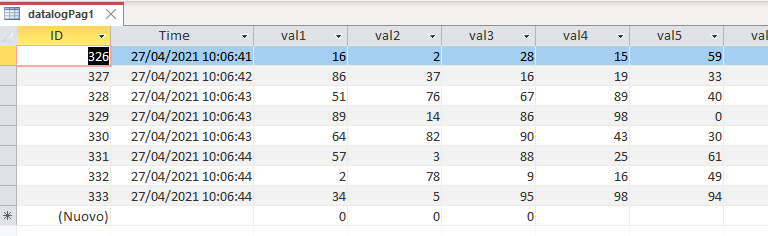

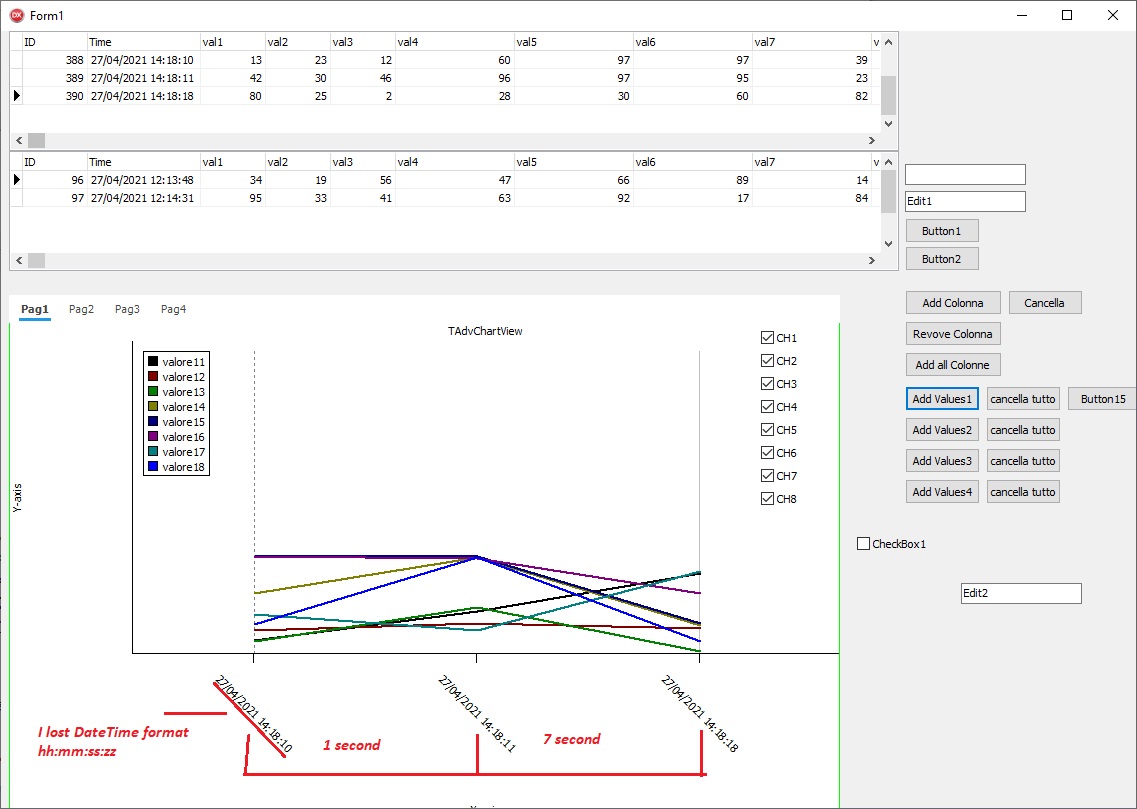
I need to have on X-Axis the real time value, with format "hours:minutes:second:millisecond"
I assigne
XAxis.MajorUnitTimeFormat := 'hh:nn:ss';
XAxis.DateTimeFormat := 'hh:nn:ss';
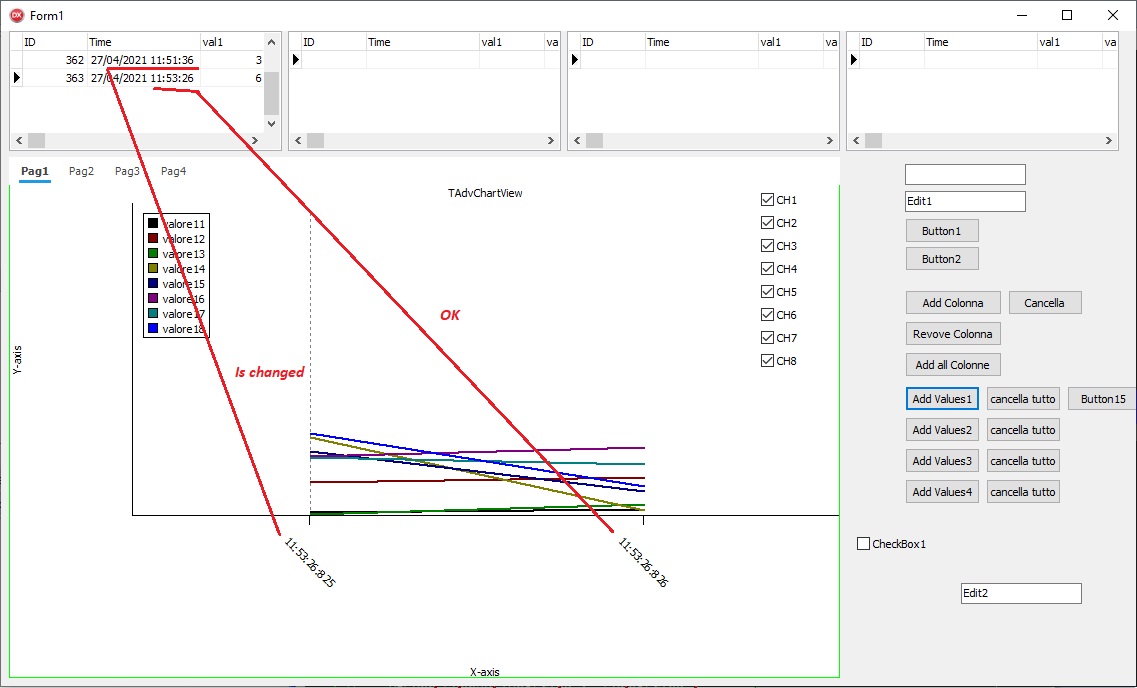
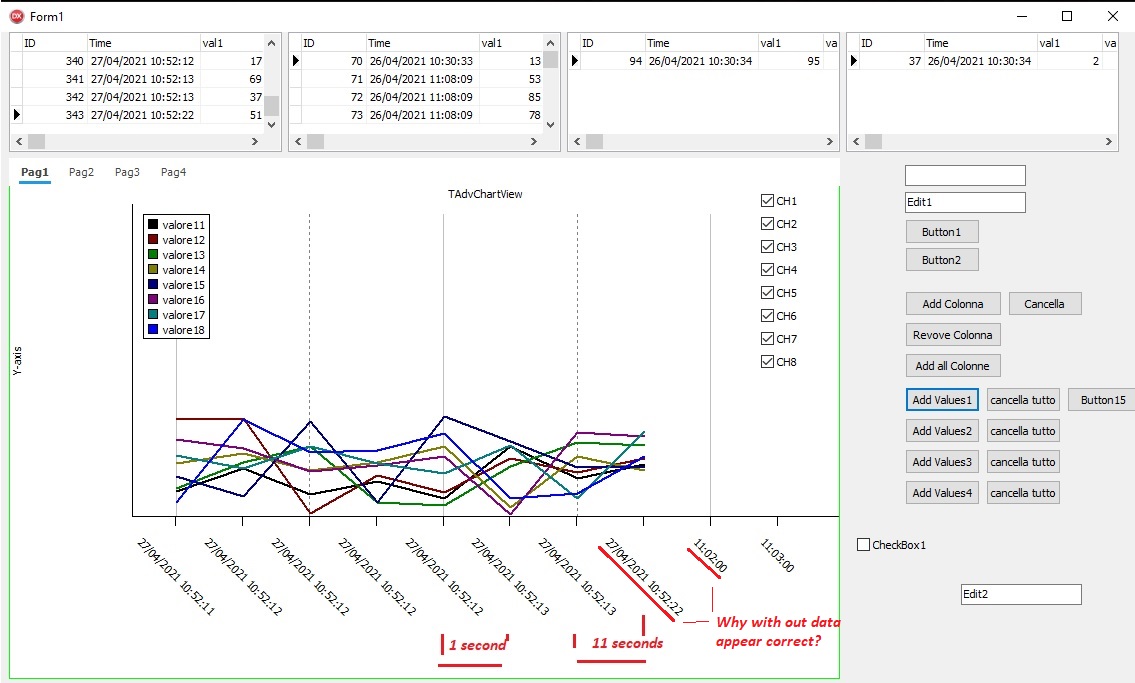
But on X-Axis appear "27/04/2021 10:52:22" instead "10:52:22" ?
Who I can add millisecond?
Why the space from a record with distance 1 second is the same space from two record with distance 13 second?
Using this code to set the panes:
procedure TForm1.GraphAddPagx(NumPan : word);
var
I : word;
begin
DBGraph.BeginUpdate;
with DBGraph.Panes[NumPan] do
begin
Series.Clear;
//Datasource property of Chart
DataSource := DSTab1;

XAxis.Position := xBottom;
XAxis.UnitType := utMinute;
XAxis.Size     := 150;

Range.StartDate := Now;

YAxis.Size := 100;
BorderColor := clLime;
XGrid.Visible := true;
XGrid.MajorDistance := 4;
XGrid.MinorDistance := 2;
XGrid.MajorLineColor := clGray;
XGrid.MinorLineColor := clsilver;


Margin.RightMargin := 30;
Bands.Distance         := 2;
Bands.GradientSteps    := 100;
Bands.PrimaryColor     := RGB(229,244,244);
Bands.PrimaryColorTo   := RGB(229,244,244);
Bands.SecondaryColor   := clWhite;
Bands.SecondaryColorTo := clWhite;
Bands.SerieIndex       := 0;
Bands.Visible          := True;


Series.Add;
with Series[0] do
begin
  LineColor := clBlack;
  FieldNameValue := 'Val1';
  FieldNameXAxis := 'Time';
  LegendText := 'valore1';
  XAxis.Visible  := True;
end;

Series.Add;
with Series[1] do
begin
  LineColor      := clMaroon;
  FieldNameValue := 'Val2';
  FieldNameXAxis := 'Time';
  LegendText     := 'valore2';
  XAxis.Visible  := False;
end;

Series.Add;
with Series[2] do
begin
  LineColor      := clGreen;
  FieldNameValue := 'Val3';
  FieldNameXAxis := 'Time';
  LegendText     := 'valore3';
  XAxis.Visible  := False;
end;

Series.Add;
with Series[3] do
begin
  LineColor      := clOlive;
  FieldNameValue := 'Val4';
  FieldNameXAxis := 'Time';
  LegendText     := 'valore3';
  XAxis.Visible  := False;
end;

Series.Add;
with Series[4] do
begin
  LineColor      := clNavy;
  FieldNameValue := 'Val5';
  FieldNameXAxis := 'Time';
  LegendText     := 'valore3';
  XAxis.Visible  := False;
end;

Series.Add;
with Series[5] do
begin
  LineColor      := clPurple;
  FieldNameValue := 'Val6';
  FieldNameXAxis := 'Time';
  LegendText     := 'valore3';
  XAxis.Visible  := False;
end;

Series.Add;
with Series[6] do
begin
  LineColor      := clTeal;
  FieldNameValue := 'Val7';
  FieldNameXAxis := 'Time';
  LegendText     := 'valore3';
  XAxis.Visible  := False;
end;

Series.Add;
with Series[7] do
begin
  LineColor      := clBlue;
  FieldNameValue := 'Val8';
  FieldNameXAxis := 'Time';
  LegendText     := 'valore3';
  XAxis.Visible  := False;
end;


for I := 0 to Series.Count - 1 do
begin
  with Series[I] do
  begin
    AutoRange := arEnabled;
    ChartType := ctXYLine;
    LineWidth := 2;
    YAxis.MajorUnit := 100;
    YAxis.MajorUnit := 0;
    ChartType := ctLine;
    AutoRange := arDisabled;
    XAxis.TextBottom.Angle := 45;
    XAxis.AutoUnits := false;
    XAxis.MajorUnitTimeFormat := 'hh:nn:ss';
    XAxis.DateTimeFormat := 'hh:nn:ss';


  end;
end;
end;
DBGraph.EndUpdate;
end;