-
That is correct, it's not a real date-time display, this needs to be calculated manually as shown in the sample. The XY Line & XY Marker types have been added afterwards. The StartDate value is necessary to show the X-Axis values.
-
Then you need to change the function to:
function ConvertDateTimeToX(Date: TDateTime): Double;
begin
  Result := MilliSecondsBetween(Date, baseDateTime) / 1000;
end;
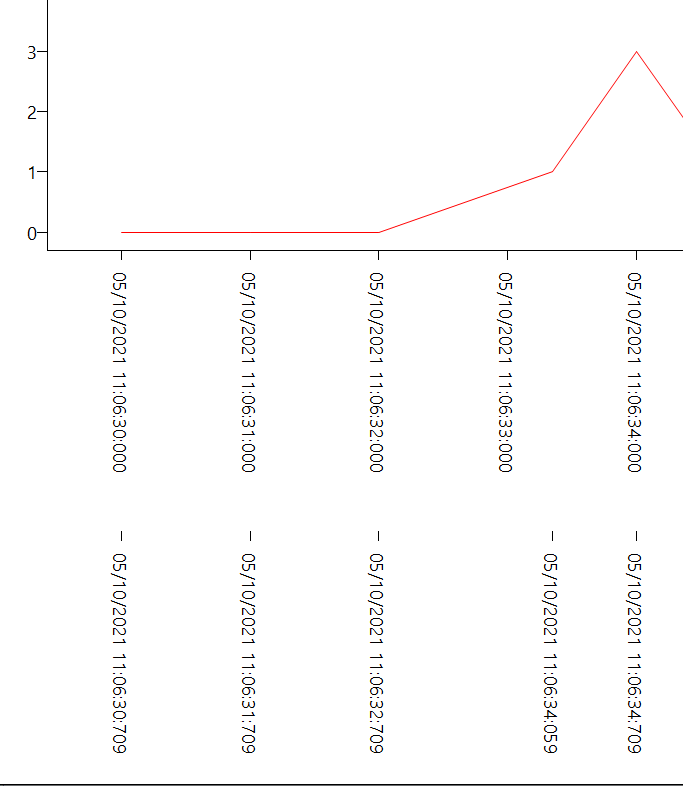
3, 4) XYValuesOffset & XYValues is to enable a secondary X-Axis with values that match the ones that you have returned via the OnGetPoint event. You don't actually need to add this unless you want to visualize the actual points. In case the UnitType of the X-Axis is utSecond the date-time formatting will show a value every second, but the values that are added to the line chart which could lie between 2 seconds will not be shown. Turning this on will visualize all the real data points on the X-Axis as well.
to visualize this, you will need to change the OnGetPoint implementation with the following code:
procedure TForm21.AdvGDIPChartView1GetPoint(Sender: TObject; Pane, Serie, AIndex: Integer; var APoint: TChartPoint);
begin
  APoint.TimeStamp := IncSecond(baseDateTime, AIndex);
  APoint.SingleXValue := ConvertDateTimeToX(APoint.TimeStamp);
  if AIndex = 3 then
  begin
    APoint.TimeStamp := IncMilliSecond(baseDateTime, (AIndex * 1000) + 350);
    APoint.SingleXValue := ConvertDateTimeToX(APoint.TimeStamp);
  end;

  APoint.SingleValue := Random(AIndex);
end;
-
No, you can safely turn on the AutoUnits, for this sample it is turned off, because the sample was copied from another sample where this was set to False for the purpose of demonstrating AutoUnits = False.
-
You can also have more than one X-Axis and this can be used to add more spacing between the different X-Axis values
-
No, this looks correct. See the full sample below modified to match your questions.
unit USample;

interface

uses
  Winapi.Windows, Winapi.Messages, System.SysUtils, System.Variants, System.Classes, Vcl.Graphics,
  Vcl.Controls, Vcl.Forms, Vcl.Dialogs, Vcl.StdCtrls, AdvChartView, AdvChartViewGDIP, AdvChart;

type
  TForm21 = class(TForm)
    Button1: TButton;
    AdvGDIPChartView1: TAdvGDIPChartView;
    procedure Button1Click(Sender: TObject);
  private
    procedure AdvGDIPChartView1GetNumberOfPoints(Sender: TObject; Pane,
      Serie: Integer; var ANumberOfPoints: Integer);
    procedure AdvGDIPChartView1GetPoint(Sender: TObject; Pane, Serie,
      AIndex: Integer; var APoint: TChartPoint);
    { Private declarations }
  public
    { Public declarations }
  end;

var
  Form21: TForm21;

implementation

{$R *.dfm}

uses
  DateUtils;

var
  baseDateTime: TDateTime;

const
  Points_Count = 10;

procedure TForm21.AdvGDIPChartView1GetNumberOfPoints(Sender: TObject; Pane, Serie: Integer; var ANumberOfPoints: Integer);
begin
  ANumberOfPoints := Points_Count;
end;

function ConvertDateTimeToX(Date: TDateTime): Double;
begin
  Result := MilliSecondsBetween(Date, baseDateTime) / 1000;
end;

procedure TForm21.AdvGDIPChartView1GetPoint(Sender: TObject; Pane, Serie, AIndex: Integer; var APoint: TChartPoint);
begin
  APoint.TimeStamp := IncSecond(baseDateTime, AIndex);
  APoint.SingleXValue := ConvertDateTimeToX(APoint.TimeStamp);
  if AIndex = 3 then
  begin
    APoint.TimeStamp := IncMilliSecond(baseDateTime, (AIndex * 1000) + 350);
    APoint.SingleXValue := ConvertDateTimeToX(APoint.TimeStamp);
  end;

  APoint.SingleValue := Random(AIndex);
end;

procedure TForm21.Button1Click(Sender: TObject);
var
  i: integer;
  d: TDateTime;
begin
  AdvGDIPChartView1.OnGetPoint := AdvGDIPChartView1GetPoint;
  AdvGDIPChartView1.OnGetNumberOfPoints := AdvGDIPChartView1GetNumberOfPoints;

  baseDateTime := Now;

  AdvGDIPChartView1.BeginUpdate;
  with AdvGDIPChartView1.Panes[0] do
  begin
    Series.Clear;
    Series.Add;
    Series.Add;
    Series.Add;
    XAxis.UnitType := utSecond;
    XAxis.Size := 130;
    Title.Size := 50;
    Title.Font.Size := 16;
    Range.StartDate := baseDateTime;
    with Series[0] do
    begin
      XAxis.Visible := True;
      YAxis.Visible := True;
      AutoRange := arCommon;
      ChartType := ctXYLine;
      LineColor := clRed;
      XAxis.TextBottom.Angle := 90;
      XAxis.AutoUnits := True;
      XAxis.XYValues := False;
      XAxis.MajorUnitTimeFormat := 'dd/mm/yyyy hh:nn:ss:zzz';
    end;

    with Series[1] do
    begin
      XAxis.Visible := False;
      YAxis.Visible := True;
      AutoRange := arEnabled;
      LineColor := clBlue;
      ChartType := ctXYLine;
      XAxis.TextBottom.Angle := 90;
      XAxis.AutoUnits := True;
      XAxis.XYValues := False;
    end;

    with Series[2] do
    begin
      XAxis.Visible := False;
      YAxis.Visible := True;
      AutoRange := arCommon;
      LineColor := clGreen;
      ChartType := ctXYLine;
      XAxis.TextBottom.Angle := 90;
      XAxis.AutoUnits := True;
      XAxis.XYValues := False;
    end;
    Range.RangeTo := Points_Count - 1;
  end;
  AdvGDIPChartView1.EndUpdate;
end;

end.