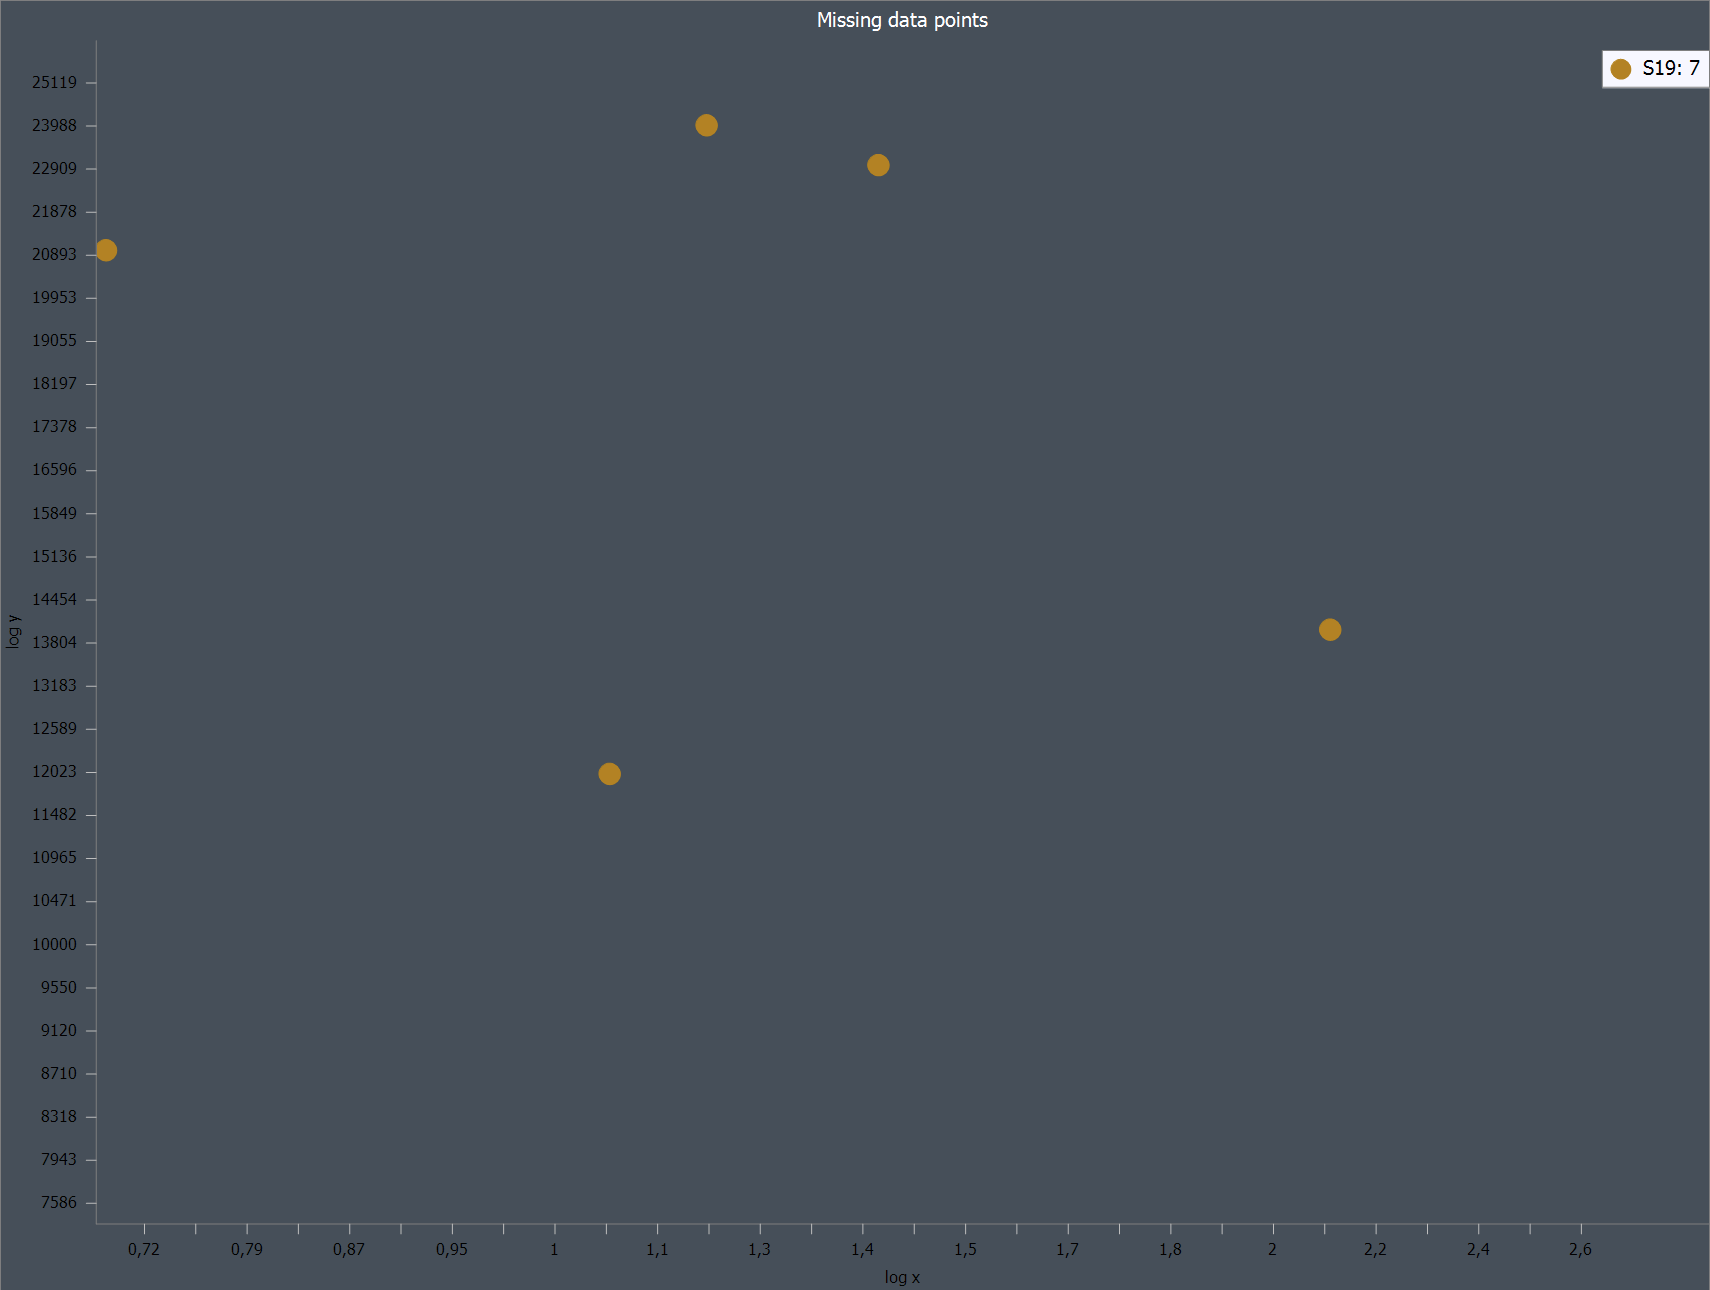
I have a sieries with 7 data points. When I plot this series (ctMarker) then only 5 data points are displayed:
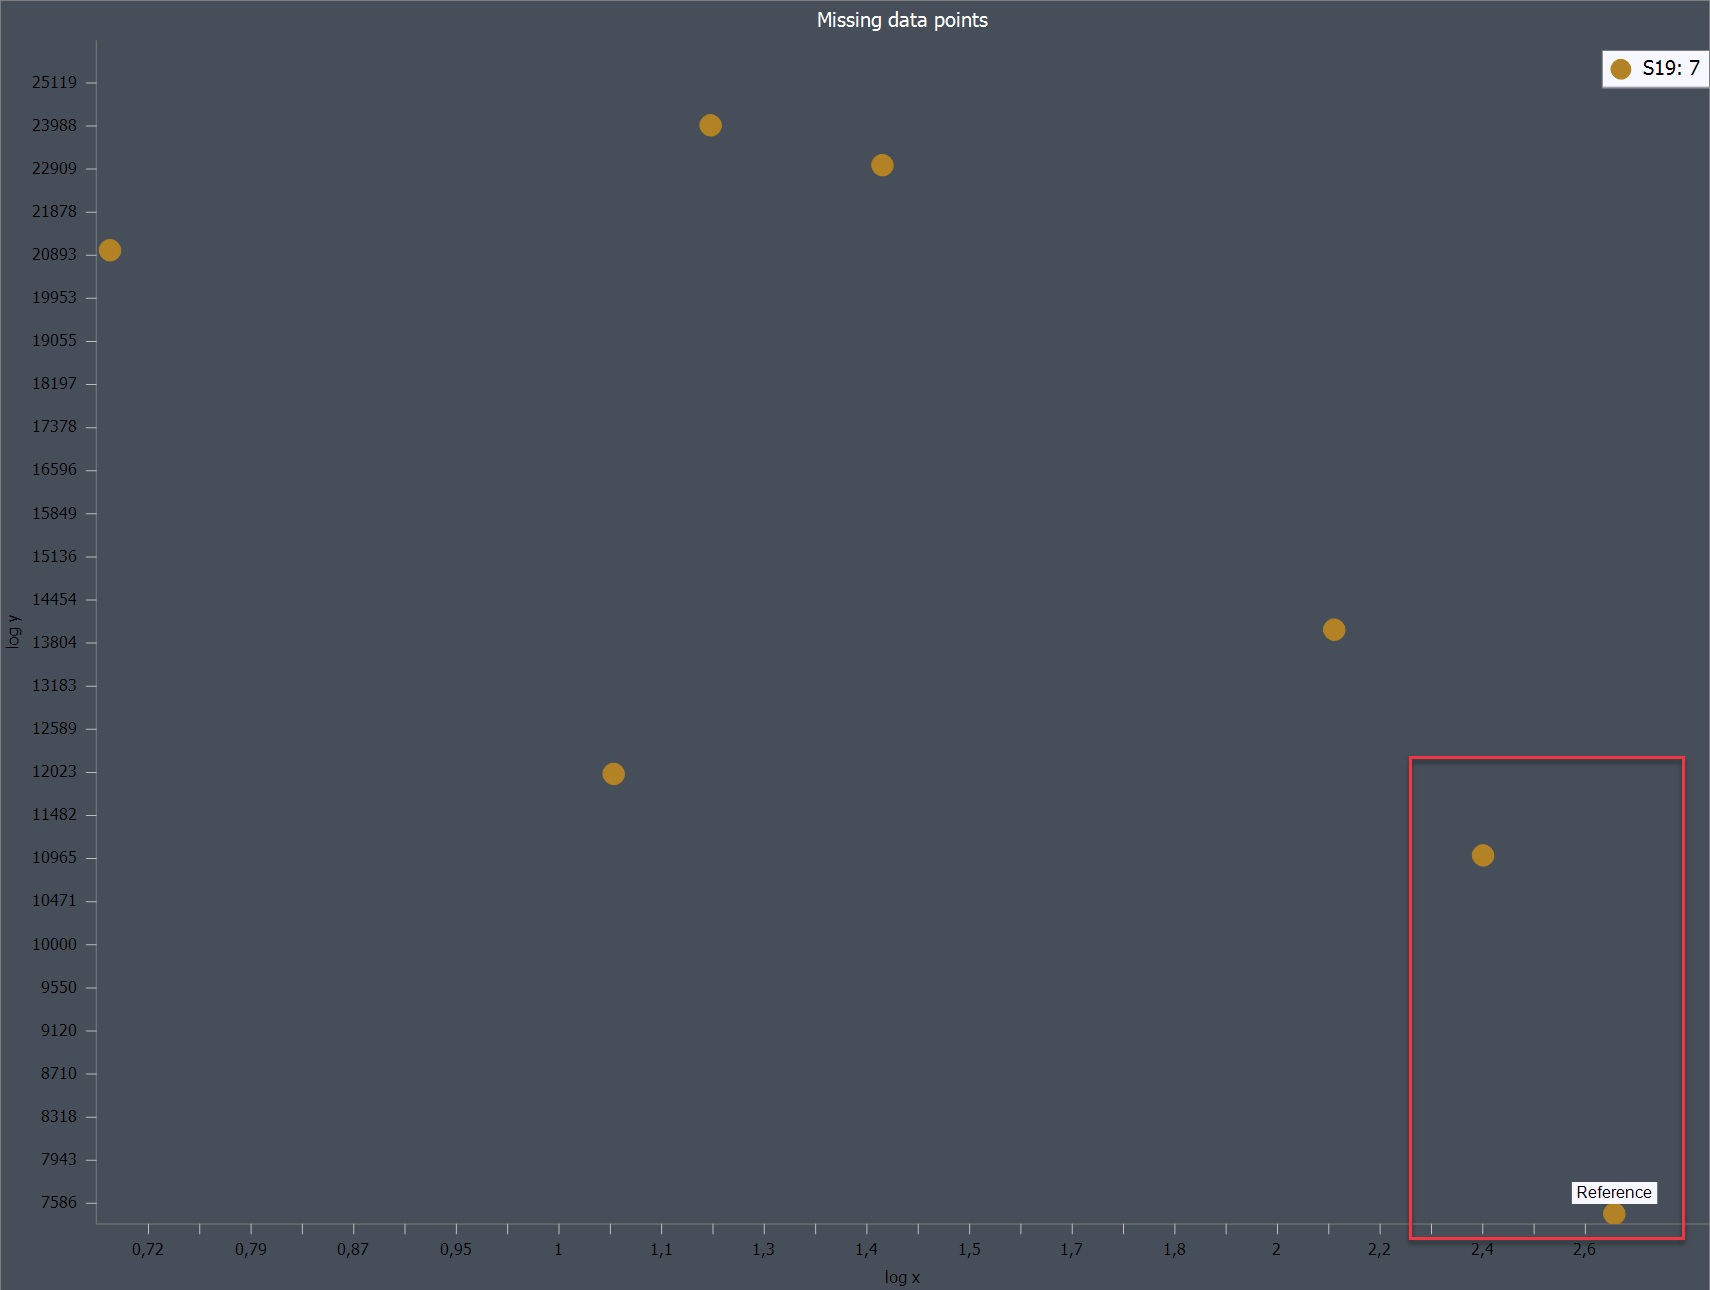
When I now pan with the mouse the x-axis horizontal by just one pixel, then the missing data points are displayed as well:
The series is attached.
ScatterXY.zip (2.4 KB)