I have just started looking at creating SVG images of Excel charts using Flexcel. These are from files I create with Flexcel. The basics are very simple and clean and fast, but unfortunately I am seeing some weirdness in the axis tick labels. They bear no resemblance to reality. Hopefully I can get a couple opf screen shots in here...
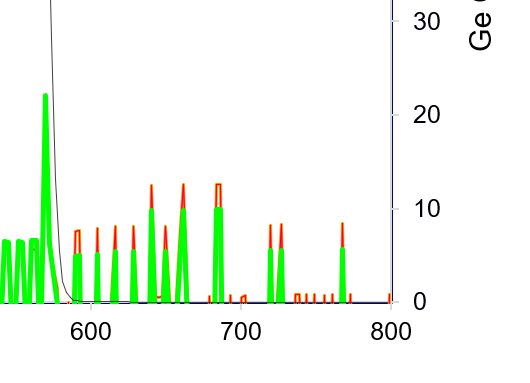
This is the right and bottom axis when I open the file in Excel
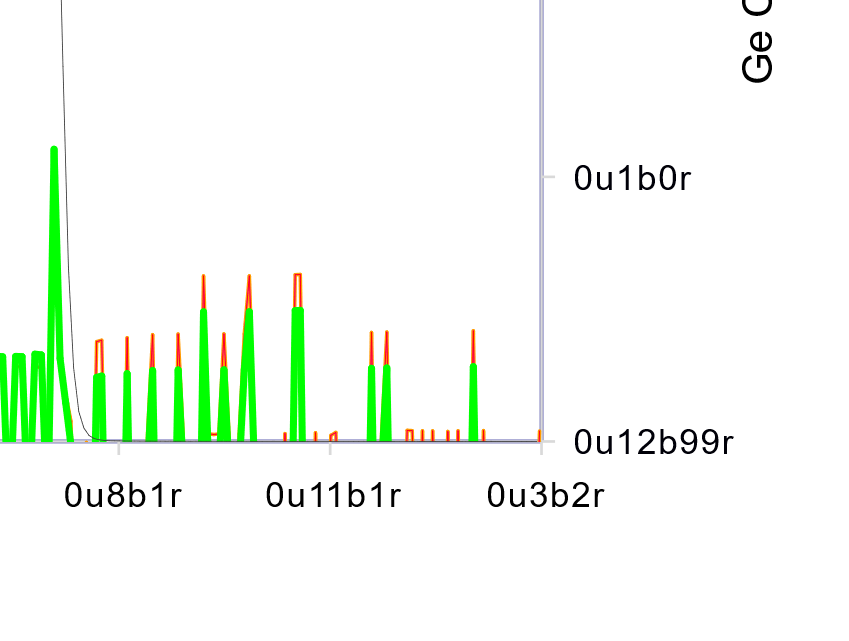
This is the right and bottom axis when I include the SVG file in Word or PowerPoint.
I have looked in the SVG file using Notepad++ and indeed the text characters do appear to be what is shown in Word, so it looks like the SVG file is not correct.
This is from Flexcel for VCL version 7.14. In case it makes any difference I am simply assigning the Flexcel workbook to the SVG exporter immediately after creating the file, rather than creating a new Workbook object and loading from disk...
//quick test of SVG
var Svg: TFlexCelSVGExport:= TFlexCelSVGExport.Create(xls, true);
try
if Svg.Workbook = nil then
Svg.Workbook:= TXlsFile.Create; //Svg.Workbook.Open(FileName);
Svg.AllowOverwritingFiles:= true;
Svg.AllVisibleSheets:= false;
Svg.SaveAsImage(
procedure (x: TSVGExportParameters)
begin
x.FileName := TPath.ChangeExtension(FileName, '') + '' + x.Workbook.SheetName + '' + IntToStr(x.SheetPageNumber) + '.svg';
end);
finally
Svg.Free;
end;
It appears the issue may be related to setting the formatting for the tick labels to "Number". When I view the file in Excel, and look at the number formatting is it showing as "General". However putting the file back through APImate shows it to be "Number". Not sure how that can be. [On reflection it appears that putting "Number" in as the formartting in Flexcel works in Excel but may not be correct. It seems that while Excel shows "Number", it may never store it that way in the xlsx file]
If I modify the file in Excel and change the right axis to "Number" and set the decimal places to 0, I get the same on the graph, but the SVG exports correctly. I also looked at that file in APImate, and when the axis is created the formatting is not "General", it is not "Number", it is "#,##0"
So for the moment I may have found at least a work-around. I guess I have to work out why I switched to "Number" in my code and what it might break on some Excel files if I switch back to General. I think I may have to pay more attention to the decimal places in my own application, and if I want "Number format may have to be very explicit in the formatting string.
Hi,
Sorry for the delay answering (was out of my country yesterday). But sometimes indeed the format for chart labels in Excel differ from FlexCel, and in the cases I've seen, it is always Excel that is wrong (if that is possible, since we define "right" as "what Excel does". But in some cases what Excel does doen't make sense)
I'll check this particular case tomorrow and see what can be done.
Thanks, I got the file.
But during the night I think I figured out what was happening anyway :)
the thing is that "Number" is not really a built-in string like "General", so what FlexCel is doing is to use it as a formatting string. Say, if the format was "dddd-mm-yyyy" it is interpreted as day-month-year. So the Format "Number" is interpreted as N (which is exponential I think, even if I'll have to look at it deeper), os that's 0. Then the second letter in "Number" is a "u", and that's why you get an u in the second letter. The third is the month, "m", which is month 1. Then the "b" is taken literally same as u because it doesn't mean anything. The "e" is for soemwhint like 1e10, and the "r" is taken literally. So you get that the number 20 formatted with a "Number" format string is "0u1b0r". 10 is "0u12b99r" since the month is 12 and the exponent 99, etc.
The question is why Excel is not doing the same, as it should, but it looks like somehow it is ignoring the text "number", even if it is not a reserved string like "General", and it should be interpreted as FlexCel is doing it.
It certainly sounds and feels about right. I will revert tousing "General" for now, and then think about how I may have to look for edge cases in my own code and how I maike decesions on formatting of tick labels (we have our own Delphi graphing component that gives us some features not found in others...)