In case it is useful to have the APImate generated code, here it is
procedure CreateExcelFile(const xls: TExcelFile);
var
ChartOptions1: IShapeProperties;
Chart1: IExcelChart;
Title: IDataLabel;
TextFillOptions: IChartFillOptions;
LabelTextOptions: IChartTextOptions;
LabelOptions: TDataLabelOptions;
ChartLineOptions: IChartLineOptions;
ChartFillOptions: IChartFillOptions;
PlotAreaFrame: IChartFrameOptions;
PlotAreaPos: TChartPlotAreaPosition;
Series: IChartSeries;
SeriesFill: IChartSeriesFillOptions;
SeriesLine: IChartSeriesLineOptions;
SeriesMarker: TChartSeriesMarkerOptions;
SeriesMisc: TChartSeriesMiscOptions;
AxisFont: TFlxChartFont;
AxisLine: TAxisLineOptions;
AxisTicks: TAxisTickOptions;
CatAxis: TBaseAxis;
ValAxis: TBaseAxis;
begin
xls.NewFile(1, TExcelFileFormat.v2019); //Create a new Excel file with 1 sheet.
//Set the names of the sheets
xls.ActiveSheet := 1;
xls.SheetName := 'Sheet1';
xls.ActiveSheet := 1; //Set the sheet we are working in.
//Global Workbook Options
//Note that in xlsx files this option is ignored by FlexCel unless you also set OptionsForceUseCheckCompatibility to true. This is because Excel disables Autosave in files which have this option.
xls.OptionsCheckCompatibility := false;
//This setting is only needed if you have names that refer to other names in the wrong order.
xls.AllowEnteringUnknownFunctionsAndNames := true;
//Set up rows and columns
xls.DefaultRowHeight := 300;
//Set the cell values
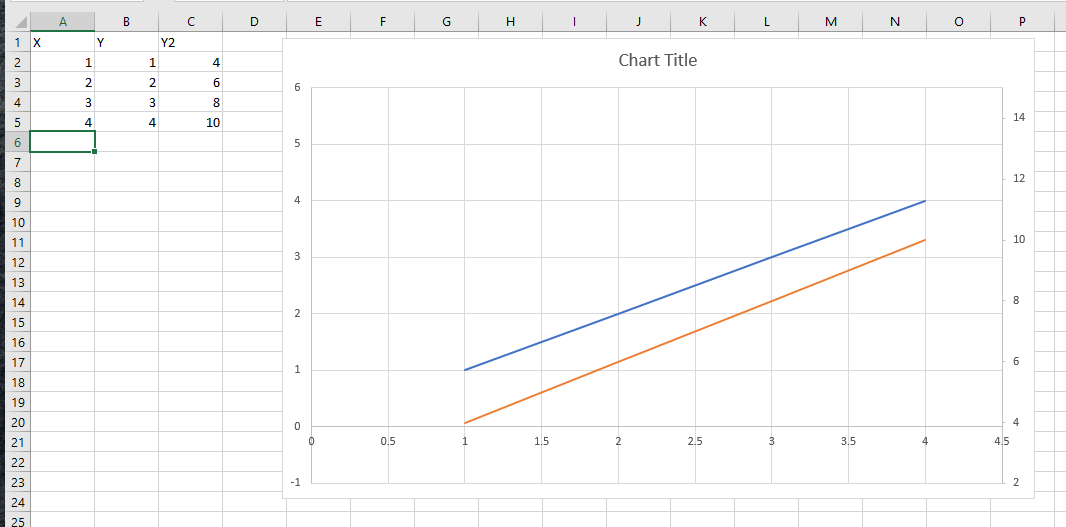
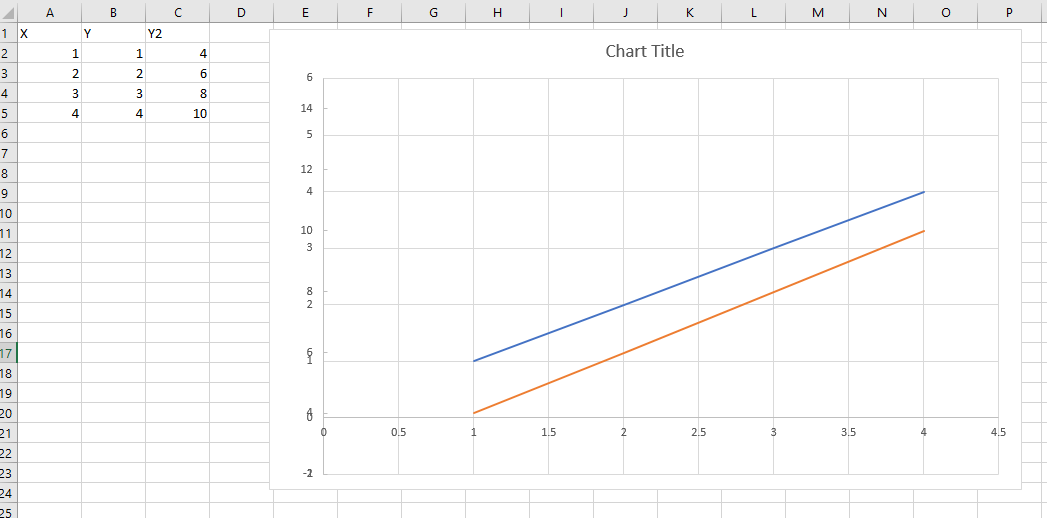
xls.SetCellValue(1, 1, 'X');
xls.SetCellValue(1, 2, 'Y');
xls.SetCellValue(1, 3, 'Y2');
xls.SetCellValue(2, 1, 1);
xls.SetCellValue(2, 2, 1);
xls.SetCellValue(2, 3, 4);
xls.SetCellValue(3, 1, 2);
xls.SetCellValue(3, 2, 2);
xls.SetCellValue(3, 3, 6);
xls.SetCellValue(4, 1, 3);
xls.SetCellValue(4, 2, 3);
xls.SetCellValue(4, 3, 8);
xls.SetCellValue(5, 1, 4);
xls.SetCellValue(5, 2, 4);
xls.SetCellValue(5, 3, 10);
//Objects
ChartOptions1 := TShapeProperties_Create();
ChartOptions1.Anchor := TClientAnchor.Create(TFlxAnchorType.MoveAndResize, 1, 89, 4, 960, 24, 89, 16, 704);
ChartOptions1.ShapeName := 'Chart 1';
ChartOptions1.Print := true;
ChartOptions1.Visible := true;
ChartOptions1.ShapeOptions.SetValue(TShapeOption.fLockText, true);
ChartOptions1.ShapeOptions.SetValue(TShapeOption.LockRotation, true);
ChartOptions1.ShapeOptions.SetValue(TShapeOption.fAutoTextMargin, true);
ChartOptions1.ShapeOptions.SetValue(TShapeOption.fillColor, 134217806);
ChartOptions1.ShapeOptions.SetValue(TShapeOption.fLine, false);
ChartOptions1.ShapeOptions.SetValue(TShapeOption.shadowColor, 16777215);
ChartOptions1.ShapeOptions.SetValue(TShapeOption.shadowOpacity, 0);
ChartOptions1.ShapeOptions.SetValue(TShapeOption.wzName, 'Chart 1');
Chart1 := xls.AddChart(ChartOptions1, TChartType.Scatter, TChartStyle.Create(102), false);
Title := TDataLabel_Create();
Title.PositionZeroBased := nil;
TextFillOptions := TChartFillOptions_Create(TShapeFill_Create(TSolidFill_Create(TDrawingColor.FromRgb($59, $59, $59)), true, TFormattingType.Subtle, TDrawingColor.FromRgb($00, $00, $00, TColorTransformArray.Create(TColorTransform.Create(TColorTransformType.Alpha, 0))), false));
LabelTextOptions := TChartTextOptions_Create(TFlxChartFont.Create('Calibri', 280, TExcelColor.FromArgb($59, $59, $59), [], TFlxUnderline.None, TFontScheme.Minor), THFlxAlignment.center, TVFlxAlignment.center, TBackgroundMode.Transparent, TextFillOptions);
Title.TextOptions := LabelTextOptions;
LabelOptions := TDataLabelOptions.Create();
Title.LabelOptions := LabelOptions;
ChartLineOptions := TChartLineOptions_Create(TShapeLine_Create(true, TLineStyle_Create(TNoFill_Create(), nil), nil, TFormattingType.Subtle));
ChartFillOptions := TChartFillOptions_Create(TShapeFill_Create(TNoFill_Create(), false, TFormattingType.Subtle, nil, false));
Title.Frame := TChartFrameOptions_Create(ChartLineOptions, ChartFillOptions, false);
Chart1.SetTitle(Title);
Chart1.Background := TChartFrameOptions_Create(TDrawingColor.FromTheme(TThemeColor.Foreground1, TColorTransformArray.Create(TColorTransform.Create(TColorTransformType.LumMod, 0.15), TColorTransform.Create(TColorTransformType.LumOff, 0.85))), 9525, TDrawingColor.FromTheme(TThemeColor.Background1), false);
ChartLineOptions := TChartLineOptions_Create(TShapeLine_Create(true, TLineStyle_Create(TNoFill_Create(), nil), nil, TFormattingType.Subtle));
ChartFillOptions := TChartFillOptions_Create(TShapeFill_Create(TNoFill_Create(), false, TFormattingType.Subtle, nil, false));
PlotAreaFrame := TChartFrameOptions_Create(ChartLineOptions, ChartFillOptions, false);
PlotAreaPos := TChartPlotAreaPosition.Create(true, TChartRelativeRectangle.Automatic, TChartLayoutTarget.Inner, true);
Chart1.PlotArea := TChartPlotArea_Create(PlotAreaFrame, PlotAreaPos, false);
Chart1.SetChartOptions(1, TScatterChartOptions_Create(false));
Series := TChartSeries_Create('=Sheet1!$B$1', '=Sheet1!$B$2:$B$5', '=Sheet1!$A$2:$A$5');
SeriesFill := TChartSeriesFillOptions_Create(nil, nil, true, false);
SeriesLine := TChartSeriesLineOptions_Create(TShapeLine_Create(true, TLineStyle_Create(TSolidFill_Create(TDrawingColor.FromTheme(TThemeColor.Accent1)), 19050, NullableTPenAlignment.Null, TLineCap.Round, NullableTCompoundLineType.Null, NullableTLineDashing.Null, TLineJoin.Round, nil, nil, nil), nil, TFormattingType.Subtle), false);
SeriesMarker := TChartSeriesMarkerOptions.Create(TChartLineOptions_Create(nil), nil, TChartMarkerType.None, true, true, 0, TUISize.Create(0, 0), false);
SeriesMisc := TChartSeriesMiscOptions.Create(false, false, false);
Series.Options.Add(TChartSeriesOptions.CreateNoClone(-1, SeriesFill, SeriesLine, nil, SeriesMarker, SeriesMisc, true));
Chart1.AddSeries(Series);
Chart1.AddSubchart(TChartType.Scatter, 1);
Chart1.SetChartOptions(2, TScatterChartOptions_Create(false));
Series := TChartSeries_Create('=Sheet1!$C$1', '=Sheet1!$C$2:$C$5', '=Sheet1!$A$2:$A$5');
SeriesFill := TChartSeriesFillOptions_Create(nil, nil, true, false);
SeriesLine := TChartSeriesLineOptions_Create(TShapeLine_Create(true, TLineStyle_Create(TSolidFill_Create(TDrawingColor.FromTheme(TThemeColor.Accent2)), 19050, NullableTPenAlignment.Null, TLineCap.Round, NullableTCompoundLineType.Null, NullableTLineDashing.Null, TLineJoin.Round, nil, nil, nil), nil, TFormattingType.Subtle), false);
SeriesMarker := TChartSeriesMarkerOptions.Create(TChartLineOptions_Create(nil), nil, TChartMarkerType.None, true, true, 0, TUISize.Create(0, 0), false);
SeriesMisc := TChartSeriesMiscOptions.Create(false, false, false);
Series.Options.Add(TChartSeriesOptions.CreateNoClone(-1, SeriesFill, SeriesLine, nil, SeriesMarker, SeriesMisc, true));
Chart1.AddSeries(Series);
Chart1.PlotEmptyCells := TPlotEmptyCells.NotPlotted;
Chart1.ShowDataInHiddenRowsAndCols := false;
AxisFont := TFlxChartFont.Create('Calibri', 180, TExcelColor.FromArgb($59, $59, $59), [], TFlxUnderline.None, TFontScheme.Minor);
AxisLine := TAxisLineOptions.Create();
AxisLine.MainAxis := TChartLineOptions_Create(TShapeLine_Create(true, TLineStyle_Create(TSolidFill_Create(TDrawingColor.FromTheme(TThemeColor.Foreground1, TColorTransformArray.Create(TColorTransform.Create(TColorTransformType.LumMod, 0.25), TColorTransform.Create(TColorTransformType.LumOff, 0.75)))), 9525, TPenAlignment.Center, TLineCap.Flat, TCompoundLineType.Single, NullableTLineDashing.Null, TLineJoin.Round, nil, nil, nil), nil, TFormattingType.Subtle));
AxisLine.MajorGridLines := TChartLineOptions_Create(TShapeLine_Create(true, TLineStyle_Create(TSolidFill_Create(TDrawingColor.FromTheme(TThemeColor.Foreground1, TColorTransformArray.Create(TColorTransform.Create(TColorTransformType.LumMod, 0.15), TColorTransform.Create(TColorTransformType.LumOff, 0.85)))), 9525, TPenAlignment.Center, TLineCap.Flat, TCompoundLineType.Single, NullableTLineDashing.Null, TLineJoin.Round, nil, nil, nil), nil, TFormattingType.Subtle));
AxisLine.DoNotDrawLabelsIfNotDrawingAxis := false;
AxisTicks := TAxisTickOptions.Create(TTickType.None, TTickType.None, TAxisLabelPosition.NextToAxis, TBackgroundMode.Transparent, TDrawingColor.FromRgb($59, $59, $59), nil);
CatAxis := TValueAxis.Create(0, 0, 0, 0, 0, [TValueAxisOptions.AutoMin, TValueAxisOptions.AutoMax, TValueAxisOptions.AutoMajor, TValueAxisOptions.AutoMinor, TValueAxisOptions.AutoCross], AxisFont, 'General', true, AxisLine, AxisTicks, nil, TChartAxisPos.Bottom, 0);
AxisFont := TFlxChartFont.Create('Calibri', 180, TExcelColor.FromArgb($59, $59, $59), [], TFlxUnderline.None, TFontScheme.Minor);
AxisLine := TAxisLineOptions.Create();
AxisLine.MainAxis := TChartLineOptions_Create(TShapeLine_Create(true, TLineStyle_Create(TSolidFill_Create(TDrawingColor.FromTheme(TThemeColor.Foreground1, TColorTransformArray.Create(TColorTransform.Create(TColorTransformType.LumMod, 0.25), TColorTransform.Create(TColorTransformType.LumOff, 0.75)))), 9525, TPenAlignment.Center, TLineCap.Flat, TCompoundLineType.Single, NullableTLineDashing.Null, TLineJoin.Round, nil, nil, nil), nil, TFormattingType.Subtle));
AxisLine.MajorGridLines := TChartLineOptions_Create(TShapeLine_Create(true, TLineStyle_Create(TSolidFill_Create(TDrawingColor.FromTheme(TThemeColor.Foreground1, TColorTransformArray.Create(TColorTransform.Create(TColorTransformType.LumMod, 0.15), TColorTransform.Create(TColorTransformType.LumOff, 0.85)))), 9525, TPenAlignment.Center, TLineCap.Flat, TCompoundLineType.Single, NullableTLineDashing.Null, TLineJoin.Round, nil, nil, nil), nil, TFormattingType.Subtle));
AxisLine.DoNotDrawLabelsIfNotDrawingAxis := false;
AxisTicks := TAxisTickOptions.Create(TTickType.None, TTickType.None, TAxisLabelPosition.NextToAxis, TBackgroundMode.Transparent, TDrawingColor.FromRgb($59, $59, $59), nil);
ValAxis := TValueAxis.Create(-1, 6, 0, 0, 0, [TValueAxisOptions.AutoMajor, TValueAxisOptions.AutoMinor, TValueAxisOptions.AutoCross], AxisFont, 'General', true, AxisLine, AxisTicks, nil, TChartAxisPos.Left, 0);
Chart1.SetChartAxis(TChartAxis_Create(0, CatAxis, ValAxis));
AxisFont := TFlxChartFont.Null;
AxisLine := TAxisLineOptions.Create();
AxisLine.DoNotDrawLabelsIfNotDrawingAxis := true;
AxisTicks := TAxisTickOptions.Create(TTickType.Outside, TTickType.None, TAxisLabelPosition.NextToAxis, TBackgroundMode.Transparent, TDrawingColor.FromSystem(TSystemColor.WindowText), nil);
CatAxis := TValueAxis.Create(0, 0, 0, 0, 0, [TValueAxisOptions.AutoMin, TValueAxisOptions.AutoMax, TValueAxisOptions.AutoMajor, TValueAxisOptions.AutoMinor, TValueAxisOptions.MaxCross], AxisFont, 'General', true, AxisLine, AxisTicks, nil, TChartAxisPos.Bottom, 0);
CatAxis.Deleted := true;
AxisFont := TFlxChartFont.Create('Calibri', 180, TExcelColor.FromArgb($59, $59, $59), [], TFlxUnderline.None, TFontScheme.Minor);
AxisLine := TAxisLineOptions.Create();
AxisLine.MainAxis := TChartLineOptions_Create(TShapeLine_Create(true, TLineStyle_Create(TSolidFill_Create(TDrawingColor.FromTheme(TThemeColor.Foreground1, TColorTransformArray.Create(TColorTransform.Create(TColorTransformType.LumMod, 0.25), TColorTransform.Create(TColorTransformType.LumOff, 0.75)))), 9525, TPenAlignment.Center, TLineCap.Flat, TCompoundLineType.Single, NullableTLineDashing.Null, TLineJoin.Round, nil, nil, nil), nil, TFormattingType.Subtle));
AxisLine.DoNotDrawLabelsIfNotDrawingAxis := false;
AxisTicks := TAxisTickOptions.Create(TTickType.Outside, TTickType.None, TAxisLabelPosition.NextToAxis, TBackgroundMode.Transparent, TDrawingColor.FromRgb($59, $59, $59), nil);
ValAxis := TValueAxis.Create(2, 15, 0, 0, 0, [TValueAxisOptions.AutoMajor, TValueAxisOptions.AutoMinor, TValueAxisOptions.AutoCross], AxisFont, 'General', true, AxisLine, AxisTicks, nil, TChartAxisPos.Right, 0);
Chart1.SetChartAxis(TChartAxis_Create(1, CatAxis, ValAxis));
//Cell selection and scroll position.
xls.SelectCell(17, 20, false);
//Standard Document Properties - Most are only for xlsx files. In xls files FlexCel will only change the Creation Date and Modified Date.
xls.DocumentProperties.SetStandardProperty(TPropertyId.Author, 'David Martel');
//You will normally not set LastSavedBy, since this is a new file.
//If you don't set it, FlexCel will use the creator instead.
// xls.DocumentProperties.SetStandardProperty(TPropertyId.LastSavedBy, 'David Martel');
//You will normally not set CreateDateTime, since this is a new file and FlexCel will automatically use the current datetime.
//But if you are editing a file and want to preserve the original creation date, you need to either set PreserveCreationDate to true:
// xls.DocumentProperties.PreserveCreationDate := true;
//Or you can hardcode a creating date by setting it in UTC time, ISO8601 format:
// xls.DocumentProperties.SetStandardProperty(TPropertyId.CreateTimeDate, '2021-11-04T19:40:25Z');
end;