Hi Pieter,
I'm using the TWebGoogleChart to generate the horizontal bar
graphs I need for my project. It is working well but I need to customize
it by modifying the TGoogleChartAxisRecord for the HAxis of my Bar
chart. Looking at the component source code and the google chart api
doc(see below) I can see that what I want to do, but when I try to
assign a JSON object string to the variables in TGoogleChartAxisRecord
the bar graph stops working.
Here's my code for trying set set the number of gridlines on the
HAxis. Am I doing something wrong here ?
Procedure TMain.WebGoogleChart1CustomizeChart(Sender: TObject;var
Options: TGoogleChartOptions);
begin
Options.HAxis.GridLines:= '{count : 5 }' ;
end;
Have a good day,
Mark
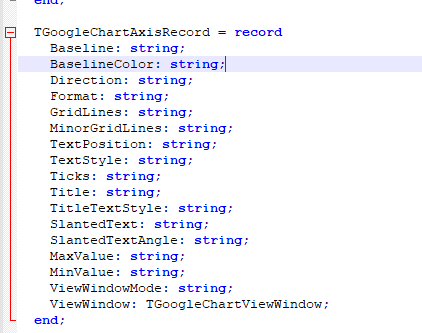
From WEBLib.GoogleChart.pas
From