Each series has an ValueToX and ValueToY function that converts the value from the grid to actual X and Y coördinates matching the current view in the chart.
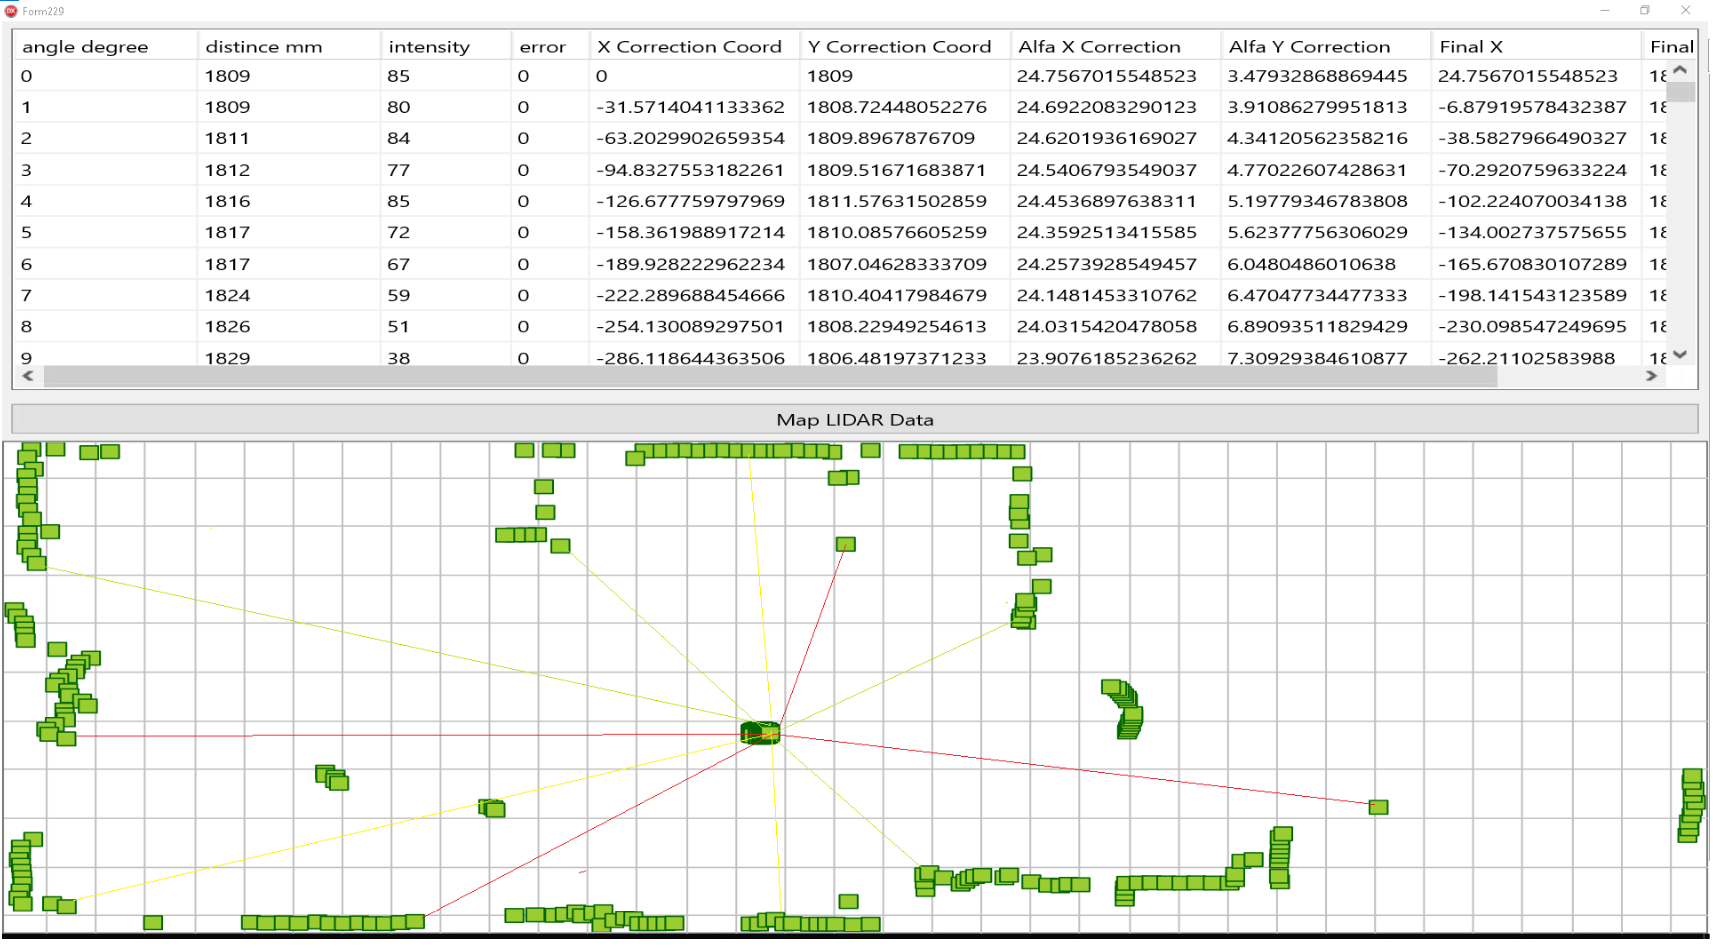
You need to use the OnAfterDrawChart event, there you can access the Canvas and you can use this event to custom draw lines on top. Alternatively you can add a new series with the points that are drawing the lines instead.
You could potentially create your own series, but it would be based on an existing series. There is currently no way to defined a custom series. This, on its own, is a very good suggestion however, and we'll investigate if we could add that option.