The other thread, about FNC Chart, has a meanwhile solution playing with XAxis.Height, but VCL Chart does not have this property (I tried, but couldn't see any effect on changing XAxis.Size in a vertical bar chart, and XAxix.BottomSize is read-only. Not even know if these "sizes" are about height.).
There aren't neither point-level legends in bar chart type, what could somehow improve display when there are larger X values text.
Making it horizontal and setting the BarValueTextType to btXAxisValue neither helps, because when the bar width is too small for the text it's also a problem.
I found that it also has an Autosize property, so setting it to false and changing XAxis.Size makes the Height change, but the label drawning does not work as in FNC Chart. When I set the height to a value like 55 or 60 in FNC Chart, it draws the "Angle"ed labels within this height.
Changing XAxis.Size in VCL Chart just limited the axis drawing area, cutting it's content.
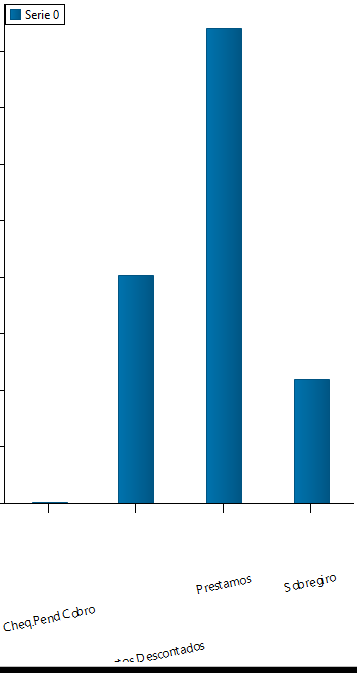
FNC Chart w/ Height=55
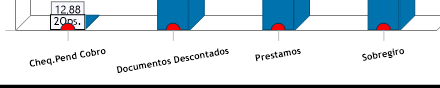
VCL Chart w/ Size=60
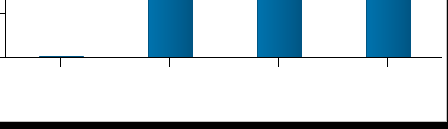
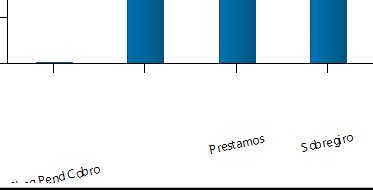
VCL Chart w/ Size=120
And please note how these letters are kind of fuzzy
We detected an issue calculating the best possible position and angle according to the text. In TMS FNC Chart we already addressed this, but still need to take a look at TMS VCL Chart as the drawing is different from FNC.