Good afternoon to all,
i'm tring to convert the last non advchart in my project into TAdvGDIPChartView.
The first problem is that the chart is insert in very small area, and i can't move it.
The second problem is that the chart have 1 pane with 2 series, one fot current year and one for last year.
X axis is a "day line" and i need to display only the day number; Chart type does not rapresnt a problem.
All points are added with AddSinglePoint procedure.
The problem i have is how set the space from one day number and next.
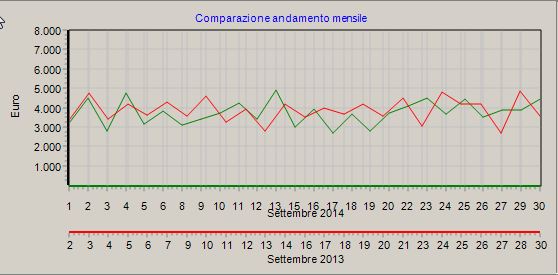
This is a old chart (real dimension)
and this is the trial chart conversion .... (the secon serie is missing at the moment); i'm tring with bar ....
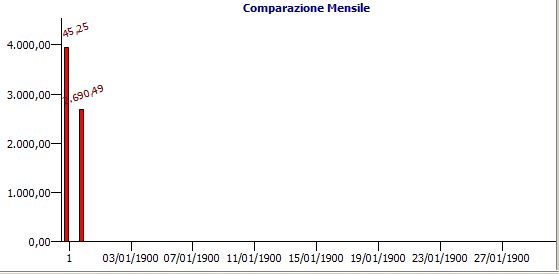
How is possible paint the string '1' in the middle of first bar??
The code i use to make test serie is
procedure TMF.ImpostaGrafico;
Var I : Integer;
begin
for I:=CHT1.Panes.Count - 1 downto 0 do
CHT1.Panes.Free;
CHT1.BeginUpdate;
// Aggiungo un nuovo panel
CHT1.Panes.Add;
CHT1.Panes[0].Range.RangeFrom:=0;
CHT1.Panes[0].Range.RangeTo:=31;
CHT1.Panes[0].CrossHair.CrossHairType:=chtFullSizeCrossHairAtCursor;
CHT1.Panes[0].CrossHair.CrossHairYValues.ShowSerieValues:=True;
CHT1.Panes[0].CrossHair.CrossHairYValues.Position:= CHT1.Panes[0].CrossHair.CrossHairYValues.Position + [chAtCursor];
CHT1.Panes[0].CrossHair.Visible:=False;
CHT1.Panes[0].Legend.Visible:=False;
CHT1.Panes[0].AxisMode:=amAxisChartWidthHeight;
CHT1.Panes[0].XAxis.UnitType:=utDay;
CHT1.Panes[0].XAxis.AutoSize:=False;
CHT1.Panes[0].YAxis.AutoSize:=True;
CHT1.Panes[0].Title.Text:='Comparazione Mensile ';
CHT1.Panes[0].Title.Font.Color:=clNavy;
CHT1.Panes[0].Title.Font.Style:=[fsBold];
CHT1.Panes[0].Title.Position:=tTop;
CHT1.Panes[0].Title.Alignment:=taCenter;
// Aggiungo una nuova serie Anno Precedente
CHT1.Panes[0].Series.Add;
CHT1.Panes[0].Series.BarChartSpacing:=5;
//CHT1.Panes[0].Series.BarChartSpacingType:=wtPixels;
CHT1.Panes[0].Series[0].CrossHairYValue.Color:=clRed;
CHT1.Panes[0].Series[0].CrossHairYValue.Font.Color:=clYellow;
CHT1.Panes[0].Series[0].ShowValue:=True;
CHT1.Panes[0].Series[0].ValueAngle:=20;
CHT1.Panes[0].Series[0].ValueFormat:='#,###,##0.#0';
CHT1.Panes[0].Series[0].ValueFormatType:=vftFloat;
CHT1.Panes[0].Series[0].ValueFont.Color:=clMaroon;
CHT1.Panes[0].Series[0].ChartType:=ctBar;
CHT1.Panes[0].Series[0].AutoRange:=arCommonZeroBased;
CHT1.Panes[0].Series[0].RangePercentMargin := 15;
CHT1.Panes[0].Series[0].XAxis.XYValues:=False;
CHT1.Panes[0].Series[0].YAxis.AutoUnits:=True;
// CHT1.Panes[0].Series[0].Enable3D:=True;
CHT1.Panes[0].Series[0].Minimum:=0;
CHT1.Panes[0].Series[0].Maximum:=120000;
CHT1.Panes[0].Series[0].AddSinglePoint(3945.25,Date,clRed,True,'1');
CHT1.Panes[0].Series[0].AddSinglePoint(2690.49,Date,clRed,True,'2');
CHT1.EndUpdate;
end;
Thank's for your help
Regard
Daniele