Hi, I have an Xdata Application, all autogenerated, with a proper Model (Firebird on Firedac).
I'm testing with a client that "stress" slightly with rest calls.
I note that:
Connection pool on Db is never Cleaned even if I modify the CleanupTimeout. They are seconds o minutes?
The application use 180 threads (Sparkle) that are never cleaned. Question: there is property for setting max number of threads to use?
Thanks in advance
The CleanupTimeout property expects value in milliseconds. The pool is cleanup whenever a new connection is requested from the pool. It doesn't clean up itself "automatically" in idle mode.
Please elaborate on the threads. Do you have steps to reproduce? How do you measure it? Sparkle uses Windows built-in thread pool, the pool size is automatically managed by Windows.
Ok for CleanupTimeout property, although I would have preferred the connections to be destroyed after a period of inactivity. This is the case at night, when there is no user activity and it is preferable to clean the pool. Or both methods together.
However, as regards the Threads used: they grow and are no longer released, even after a long time (at least this is what I have noticed). It is necessary to ensure that a fixed and maximum number of threads is used, beyond which it is necessary to create the queue and reuse them (via parameter). Otherwise everything ends up blocking due to exhausted resources.
Is there a way to change the max number of threads to use in http.sys?
Thank you
I don't know what you are talking about threads, as you didn't indicate how you measure those threads, what exact symptoms are you getting, etc.. I can't give you an advice if I don't know what is being discussed.
Ok, Wagner, I'll try to explain myself better.
I performed a stress test of a simple XData server with entities exposed via Rest. The test is carried out by a Delphi client.
If I make a request cycle: 1 thread containing 100 or 1000 requests, the threads used by Xdata are correct (6-7) because in any case the client uses only one connection thread for the multiple requests (queue).
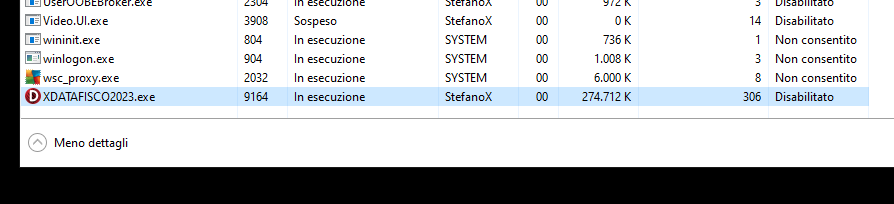
But if I do this request cycles (to simulate an attack or a heavy load with many users): 300 threads with 10 requests each, Xdata uses 306 threads for operations.
Instead, I thought that the threads used by Xdata (via Http.Sys) should be gradually reused, with a maximum number to be parameterized, and manage the request queues within that maximum number.
If Threads are managed directly by Http.Sys, is there a way to indicate a limit to use (and reuse)?
I hope I have explained myself
The threads are managed by Windows itself, via a thread pool. I assume Windows is smart enough and the best one to figure out how many threads should be used.
So I simply assume this behavior is optimal. Are you having any issue with this? Any symptom? Any misbehavior?
No, not for the moment. I'm just observing Xdata's behavior under stress. But I thought there were parameters to set to "tune" the resources and memory to be used.
For example, I notice that, after the stress, the used memory, including the number of threads created, are not released by the server (process explorer) ... which instead happens for the client application. In theory, after intensive processing, everything should return to its initial state. Is there some form of caching of something? However I'll do some more tests and see how it performs.
Thank you
That is all managed by the OS, including the memory. I guess it will release memory when it thinks is needed. XData and Sparkle general uses very low memory, it's one of its great features.
Unless, of course, you have some memory leak in your code, then the memory will increase and never decrease.