Hi,
I believe I'm making a mistake when creating a chart that combines bar and line graphs.
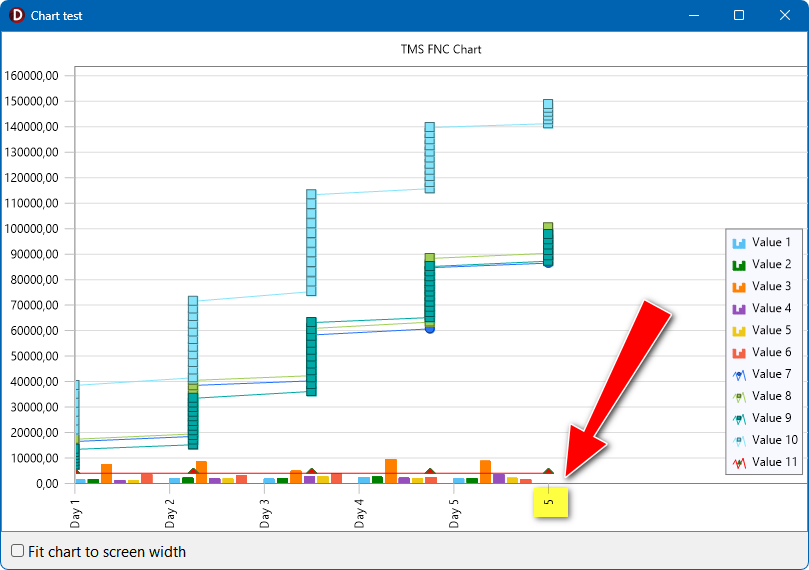
I plot 5 points on the graph, but an extra point appears on the X-axis label:
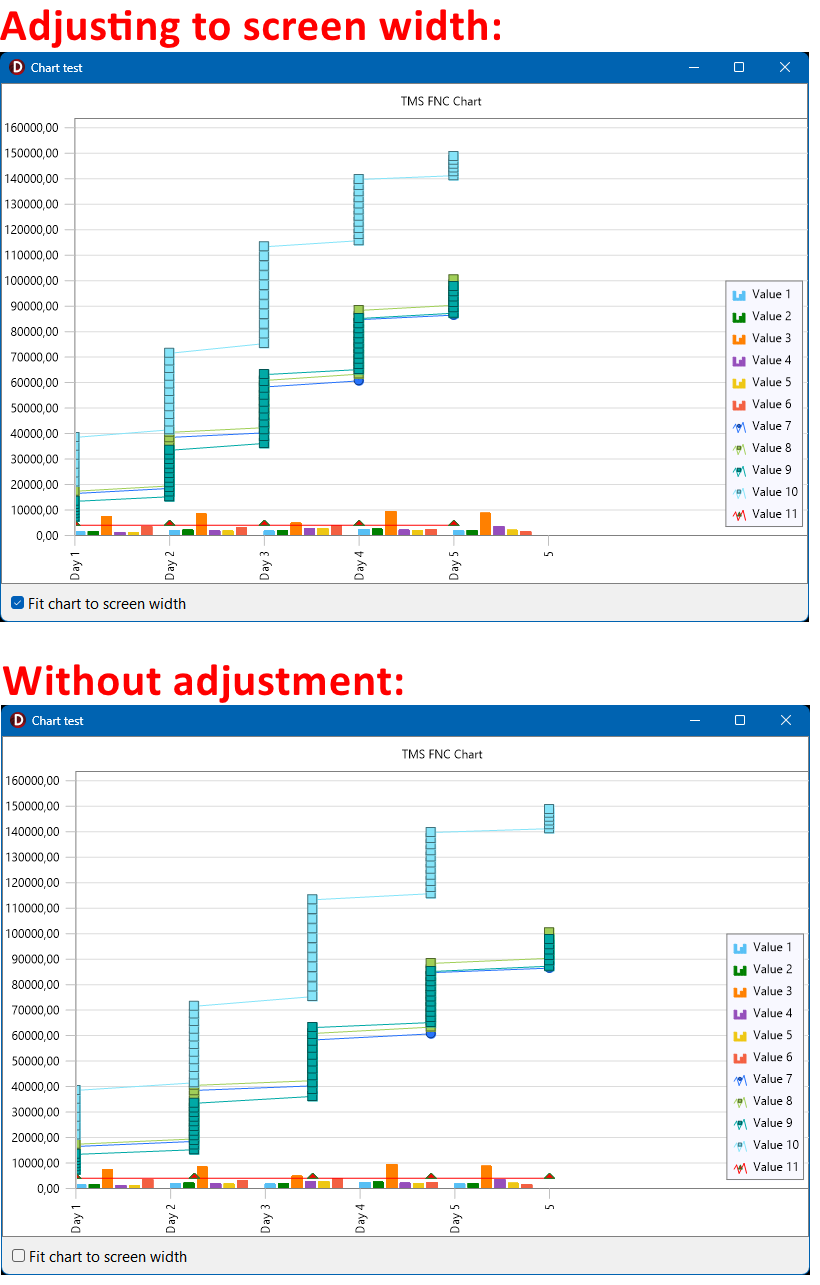
And when I tell it to adjust the chart to the screen width, the line chart changes position:
I am sending a sample program that demonstrates these two problems.
Chart.zip (72.8 KB)
Could you please check what I'm doing wrong, or if it's an issue with the FNC Chart?
Thank you