Polygons labels

Hello,
I am using WebOSMaps to draw some polygons on the map.
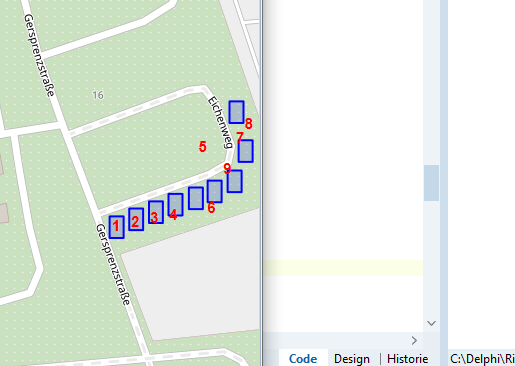
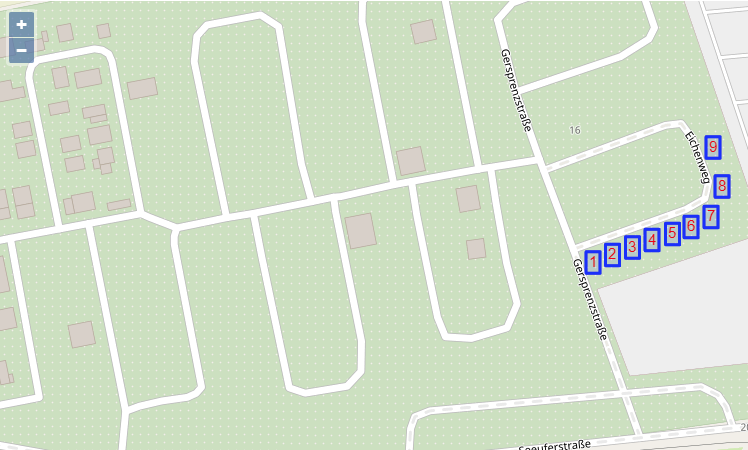
When i try to set labels in the middle of polygons its shows me just first label correctly.
Below is my example...

Can you confirm that ?

procedure TfmMainDlg.RefreshMap;
type
  TPlotArray = Array [0..2] of Double;
var
  plotArr1 : Array of TPlotArray;

  square: TMapPolygon;
  PolygonItem: TPolygonItem;
begin
  SetLength(plotArr1, 9);
  plotArr1[0,0] := 49.686563;
  plotArr1[0,1] := 8.428153;
  plotArr1[0,2] := 1;

  plotArr1[1,0] := 49.686590;
  plotArr1[1,1] := 8.428258;
  plotArr1[1,2] := 2;

  plotArr1[2,0] := 49.686615;
  plotArr1[2,1] := 8.428364;
  plotArr1[2,2] := 3;

  plotArr1[3,0] := 49.686641;
  plotArr1[3,1] := 8.428469;
  plotArr1[3,2] := 4;

  plotArr1[4,0] := 49.686663;
  plotArr1[4,1] := 8.428578;
  plotArr1[4,2] := 5;

  plotArr1[5,0] := 49.686687;
  plotArr1[5,1] := 8.428679;
  plotArr1[5,2] := 6;

  plotArr1[6,0] := 49.686722;
  plotArr1[6,1] := 8.428786;
  plotArr1[6,2] := 7;

  plotArr1[7,0] := 49.686827;
  plotArr1[7,1] := 8.428845;
  plotArr1[7,2] := 8;

  plotArr1[8,0] := 49.686962;
  plotArr1[8,1] := 8.428796;
  plotArr1[8,2] := 9;

  osmMap.MapOptions.DefaultLatitude := 49.686719;
  osmMap.MapOptions.DefaultLongitude := 8.426020;
  osmMap.MapOptions.ZoomMap := 18;

  for var i : Integer := 0 to length(plotArr1)-1 do
  begin
    PolygonItem := osmmap.Polygons.Add;
    square := PolygonItem.Polygon;
    square.PolygonType := ptRectangle;
    square.BackgroundOpacity := 40;
    square.BorderWidth := 2;
    square.Bounds.SouthWest.Latitude := plotArr1[i,0];
    square.Bounds.SouthWest.Longitude := plotArr1[i,1];
    square.Bounds.NorthEast.Latitude := plotArr1[i,0] + 0.000075;
    square.Bounds.NorthEast.Longitude := plotArr1[i,1] + 0.000075;
    square.LabelText := FloatToStr(plotArr1[i,2]);
    square.LabelFont.Color := clRed;
    square.LabelFont.Size := 15;
    square.LabelFont.Style := [fsBold];

    osmmap.CreateMapPolygon(square);
  end;
  osmMap.Launch;
end;

OSmap

Hi Vladimir,

Unfortunately it seems this is an issue with the version of the OpenLayers API framework (which is now deprecated) that TMS VCL WebOSMaps is based on.

Please note that this issue is not present in our new mapping solution TMS FNC Maps. The TTMSFNCOpenLayers component from TMS FNC Maps is based on the latest version of the OpenLayers API.

I've recreated the sample using TTMSFNCOpenLayers, here the polygon labels are displayed as expected:

procedure TForm4.TMSFNCOpenLayers1MapInitialized(Sender: TObject);
type
  TPlotArray = Array [0..2] of Double;
var
  plotArr1 : Array of TPlotArray;

  c: TTMSFNCMapsCoordinateRecArray;
  p: TTMSFNCOpenLayersPolygon;
  i: integer;
begin

  SetLength(plotArr1, 9);
  plotArr1[0,0] := 49.686563;
  plotArr1[0,1] := 8.428153;
  plotArr1[0,2] := 1;

  plotArr1[1,0] := 49.686590;
  plotArr1[1,1] := 8.428258;
  plotArr1[1,2] := 2;

  plotArr1[2,0] := 49.686615;
  plotArr1[2,1] := 8.428364;
  plotArr1[2,2] := 3;

  plotArr1[3,0] := 49.686641;
  plotArr1[3,1] := 8.428469;
  plotArr1[3,2] := 4;

  plotArr1[4,0] := 49.686663;
  plotArr1[4,1] := 8.428578;
  plotArr1[4,2] := 5;

  plotArr1[5,0] := 49.686687;
  plotArr1[5,1] := 8.428679;
  plotArr1[5,2] := 6;

  plotArr1[6,0] := 49.686722;
  plotArr1[6,1] := 8.428786;
  plotArr1[6,2] := 7;

  plotArr1[7,0] := 49.686827;
  plotArr1[7,1] := 8.428845;
  plotArr1[7,2] := 8;

  plotArr1[8,0] := 49.686962;
  plotArr1[8,1] := 8.428796;
  plotArr1[8,2] := 9;

  SetLength(c, 4);

  TMSFNCOpenLayers1.BeginUpdate;
  TMSFNCOpenLayers1.SetCenterCoordinate(49.686719, 8.427020);
  TMSFNCOpenLayers1.SetZoomLevel(18);
  for i := 0 to length(plotArr1) - 1 do
  begin
    //NorthWest
    c[0].Latitude := plotArr1[i,0];
    c[0].Longitude := plotArr1[i,1] + 0.000075;
    //NorthEast
    c[1].Latitude := plotArr1[i,0] + 0.000075;
    c[1].Longitude := plotArr1[i,1] + 0.000075;
    //SouthEast
    c[2].Latitude := plotArr1[i,0] + 0.000075;
    c[2].Longitude := plotArr1[i,1];
    //SouthWest
    c[3].Latitude := plotArr1[i,0];
    c[3].Longitude := plotArr1[i,1];

    p := TMSFNCOpenLayers1.AddPolygon(c);
    p.StrokeColor := gcBlue;
    p.StrokeWidth := 3;
    p.FillColor := gcBlue;
    p.FillOpacity := 0.1;
    p.&Label.Text := FloatToStr(plotArr1[i,2]);
    p.&Label.FontColor := gcRed;
    p.&Label.FontSize := 15;
    p.&Label.BackgroundColor := gcNull;
    p.&Label.BorderColor := gcNull;
  end;
  TMSFNCOpenLayers1.EndUpdate;
end;