points with equal Y values

if I set the Y-Values units to auto

TMSFNCChart1.Series[0].YValues.AutoUnits := true;
MinXOffset / MaxXOffset / MinYOffset / MaxYOffset = 2%

and then add several points with the same Y-Values,
the Y-Axis is not displayed and the line is not visible.
As soon as a value is different it works.
if I turn off autounits and set majorunits to 1 then the axis is displayed but the line is still missing.

TMS Webchart

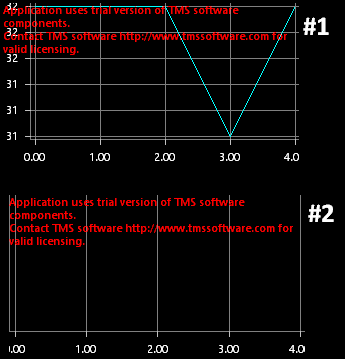
#1 Points 1=32 / 2= 32 / 3 = 31 / 4 = 32
#2 Points 1=32 / 2= 32 / 3 = 32 / 4 = 32

Can you try using AutoYRange := arEnabledZeroBased, or specify your own minimum and maximum y-values? With arEnabled and Autounits, it will not find the minimum and maximum as its technically the same.

I have tested all of them.
I do it now myself.

It would need only the inquiry whether min/max is equal, to set then a difference.

  DifY := (MaxY - MinY);
  if (DifY < 0.5) then begin
    MinY := MinY - 0.5;
    MaxY := MaxY + 0.5;
  end;

  ch_DpLog.Series[0].MinY := MinY;
  ch_DpLog.Series[0].MaxY := MaxY;