No pagebreak with two independent TObjectLists

Hello together,

we have the following problem:
we would like to create an excelreport with two independent TObjectLists side by side. One List on the left side (for example Tabelle1!$A$31:$F$31) and one list on the right side  =Tabelle1!$G$31:$L$31). We use the function addTable 
We define each range in the Excel file with one underline (_list1_ (=Tabelle1!$G$31:$L$31) , _list2_(=Tabelle1!$G$31:$L$31)), otherwise we get an error with master and detail relationship. Also the two ranges fill one row col A-L without unused columns in between.

And now the Problem.
In the Lists there are too much items for one page. In this situation flexcelreport don't break the page. The follow items and the text under it are missing.

If we use only one TObjectList in the Document, it works problem-free.

if you need an example, let me know. 

Thank you for your help.

Hi,

Can you send me the template and the result file to adrian@tmssoftware.com ?
I can't think in why this wouldn't be working, so maybe looking at the file I can get an idea.

Hi Adrian,


the problem lied within the .xls file itself. The data was actually in it, but it wasn't printed out (basically applying line breaks on the last column and reset of the print area did the trick. Now the pagecount/printout is also correct) - Sorry for bothering you with that.

There's still one problem we couldn't figure out:
Beneath the two ranges we've got a few lines of text which is only printed out on the left side (it's the area for the first range - col A-F)
The lines are connected (row 28-34) and fill out the horizontal area of both ranges (col A-K).
If I save the report before generating the .pdf-file, the lines are falsely connected (they only cover the range A-F, not A-K anymore). 

We tried changing the height of one line before (and then entering the block of text) which apparently doesn't stick with the cell. (the height/format of the cell won't be "pushed" down like the text which is in it. The higher cell will be used by the text of the two range lists)

Is there any fix for this (besides not combining/altering height of cells)? 
Maybe you could have a look into it. I've just sent you an E-Mail with the .zip-File of a demo project (it contains the template (demo.xls), the result (output.pdf) and the source code of the program).

Thanks in advance!

Hi,

Thanks for the file, I could see what is happening now. I am afraid that I don't have a simple solution, but let's start by the beginning:

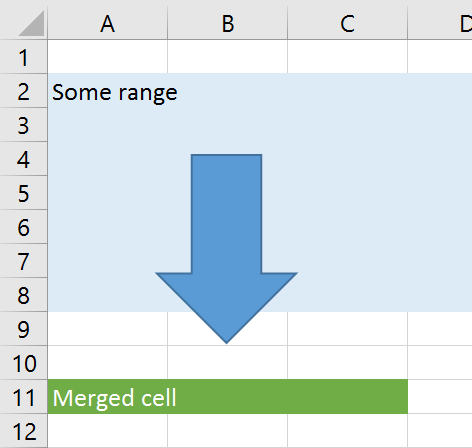
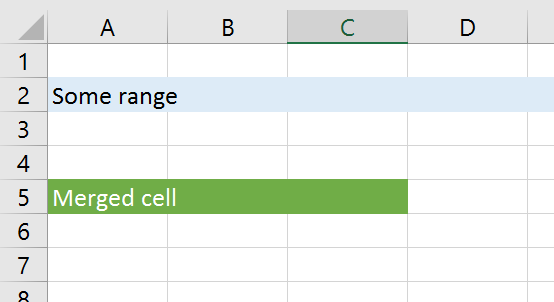
When you have a range (2 underscores) the full row is moved down. So if you have a merged cell in the original template (marked in green):


And you insert full rows, you will get this after the report runs:


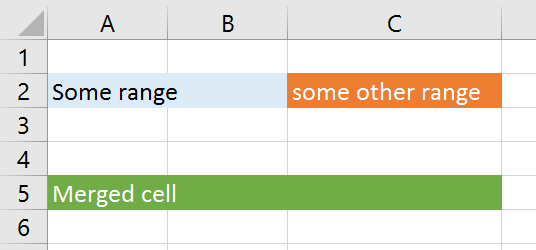
Up to here, everything is as expected. But if you "break" the report into 2 ranges, as in the following image (blue and orange ranges):


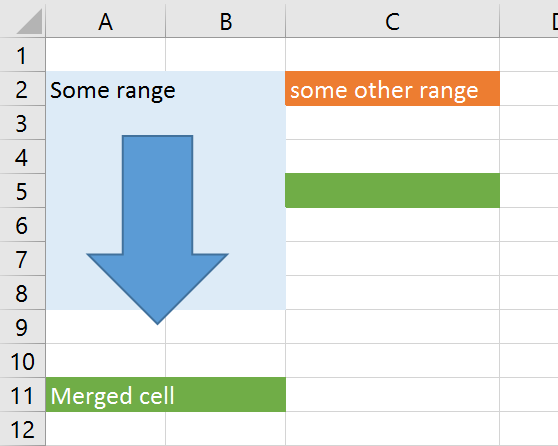
 then when the first range runs, the merged cell will be broken, as it is the only way to insert some cells (as opposed to a full row):


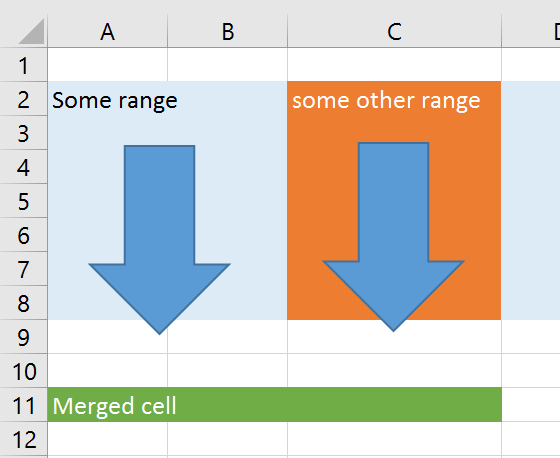
When the orange range runs later, the green cell at the right will move down, but the merged cell will still be broken:


There is no really a way around this: the only solution would be if the reports run in a different way. But as they run today, that is inserting ranges of cells, you will break the merged cell. Excel does the same, when I was inserting the range of cells for the screenshots, it showed this dialog:


Something similar happens with the print area too (which I guess was your original problem). When the first range runs, the print area can't grow because only half of the print area should grow (the half where you are inserting the range). When the second range runs it happens again, the print area can't grow either. While when you inserted full rows, the print area moved down with the inserted cells.

Now, for the solutions: As said, there is no simple one, but there are workarounds.

1)The simplest is as you did in this case, don't have a print area, and don't have a merged cell below the ranges inserted which uses more columns than the range inserted. But well, this is kind of a no-solution, and I don't think it applies in your case. In others, it might be worth doing it.

2)The second option would imply going back to a single full row range, which I guess is the best solution in this case. You could use a <#dbvalue> tag to get the values of range b into range a, or you could define a TJoinedVirtualDataTable object which would use both lists and return them as a single object.

I think creating the TJoinedVirtualDataTable object is the best in this case, but right now I have to go and I won't be able to show you an example until later today. When I come back I will send you your example modified to use a TJoinedVirtualDataTable.

Ps: Would it be ok if I post the modified example here as it doesn't seem to have private data, or do you prefer that I send it to you by email?


Hi Adrian,


thanks for the quick reply and the visual explanation, I appreciate it!
Feel free to post the modified example as it doesn't contain any private data.


Hi,


Well, first of all and after thinking about it for the night, I think that we should provide a simpler way to do this. So for 6.7.3 which should be out in some days we will include a "JOIN" command in the datasets, which will do basically what I do in this example. You might want to wait for that, as it will be simpler (And will come with a demo).

But anyway, as I think it can be interesting to see how it could be done without anything extra, here is an example which should work in your case.

http://www.tmssoftware.biz/flexcel/samples/DemoMultipleRanges.zip

The main thing here is that we create a new VirtualDataTable/VirtualDataTableState to work as a DataSource for the reports. FlexCel reports always use VirtualDataTables as datasources: If you use an array it is wrapped into a TVirtualArrayDataTable, and a TDataSet is wrapped into a TVirtualDataSet.

So here we define a new kind of DataTable, one that internally has a list of DataTables. When you ask it for a column, it will search for that column in his list of DataTables and return the value from the correct one. For this particular example, since you use the same objects for table1 and table2, they have the same columns, so we can't know if <#test.col2> refers to test1.col2 or test2.col2. So for this case, I used a new syntax: The table name is appended as a prefix, and after that goes an underscore, like:
<#test.test1_col2>
But if test1 and test2 are different, you could just check the column names. This is done in the method
function TJoinTables.GetColumnName(const columnIndex: Int32): UTF16String;

of the new TJoinTables virtual data table.

Once we have defined this TJoinTables datatable (and you can reuse the one in this example), then the rest is easy. You create a new TJoinTables with your 2 tables, and use that as datasource for the report.