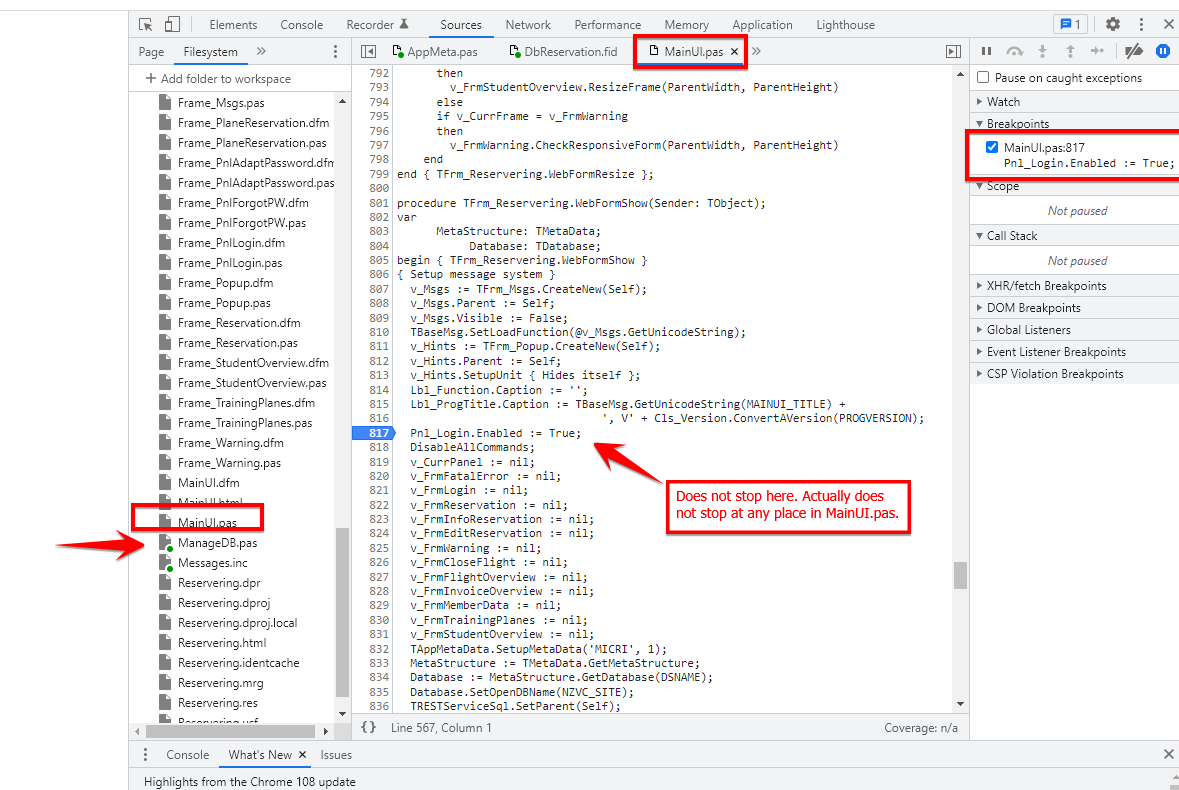
During a test session, I was making some small changes to the main program. After compilation in debug mode and pressing F12 in the browser, I still was able to put some breakpoints, but the application no longer stopped on any of them. Then I noticed that only a few sources at the left were marked with a green dot. I can only add breakpoints on lines in those sources and there the debugger stops.
For some reason, there is no longer a link to the mapping file and the source files. I have no idea how this link disappeared and even less how to restore it.
I rebuild the dpr and drpoj files from scratch and stepwise added more source files. Initially, this worked and suddenly the links seem to disappear. I don't know how have my project fully working again in debug mode.
Attached a screen shot of the debugger screen of the browser.
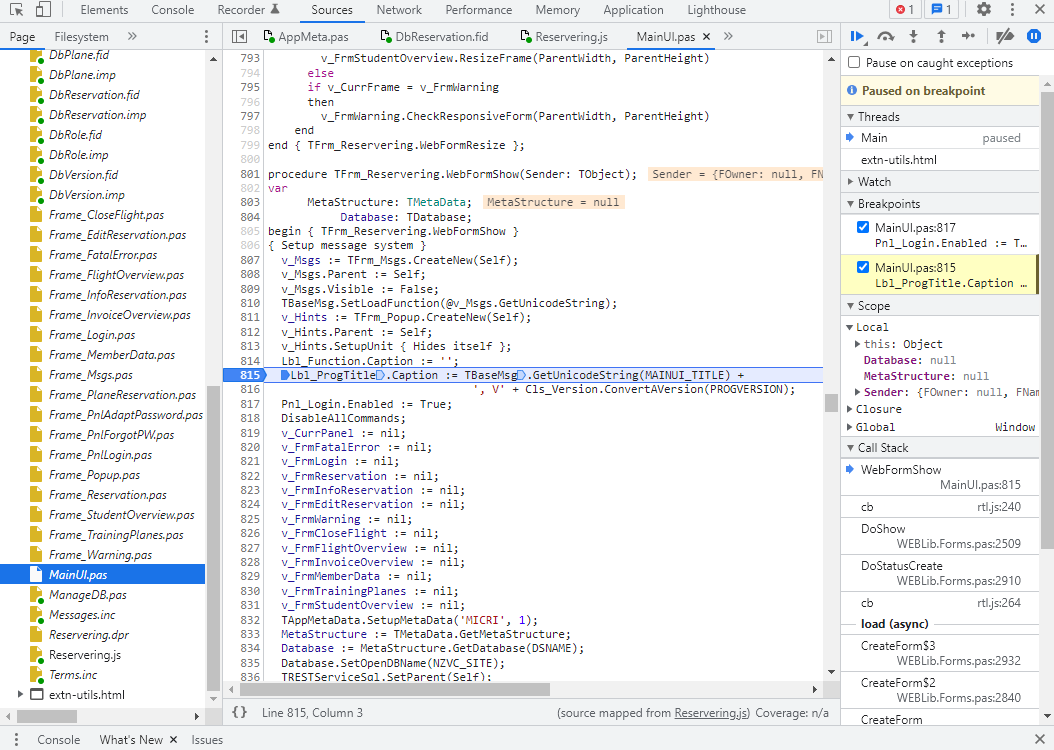
I reloaded the application and clicked on "page" in the upper left corner and restarted the application. I then saw two occurrences of the same source in the top bar. After removing one, the application suddenly started to show the breakpoints as usual and the debugger stops again at those points.
Below the screen as it looks now.
I have still no idea what happened and how I solved it. Is there a limit of some sort on debug structures?